This page gives details on the widgets that are in the “Air” subsection. They can be accessed by customizing the XCTrack Pro pages pre-installed on AIR³. Remember that your customisations will be lost if you reset XCTrack Pro interface with AIR³ Manager, if you change the profile (Kiss, Easy, Expert, Paramotor) or if you load a different configuration file ‘xcfg’.
Click on the + sign to read the details.

Wind speed from weather stations around you can also be obtained from a webpage widget. Read more details about how to configure a webpage widget using Windspion URL here.
Use this barcode to configure the URL:


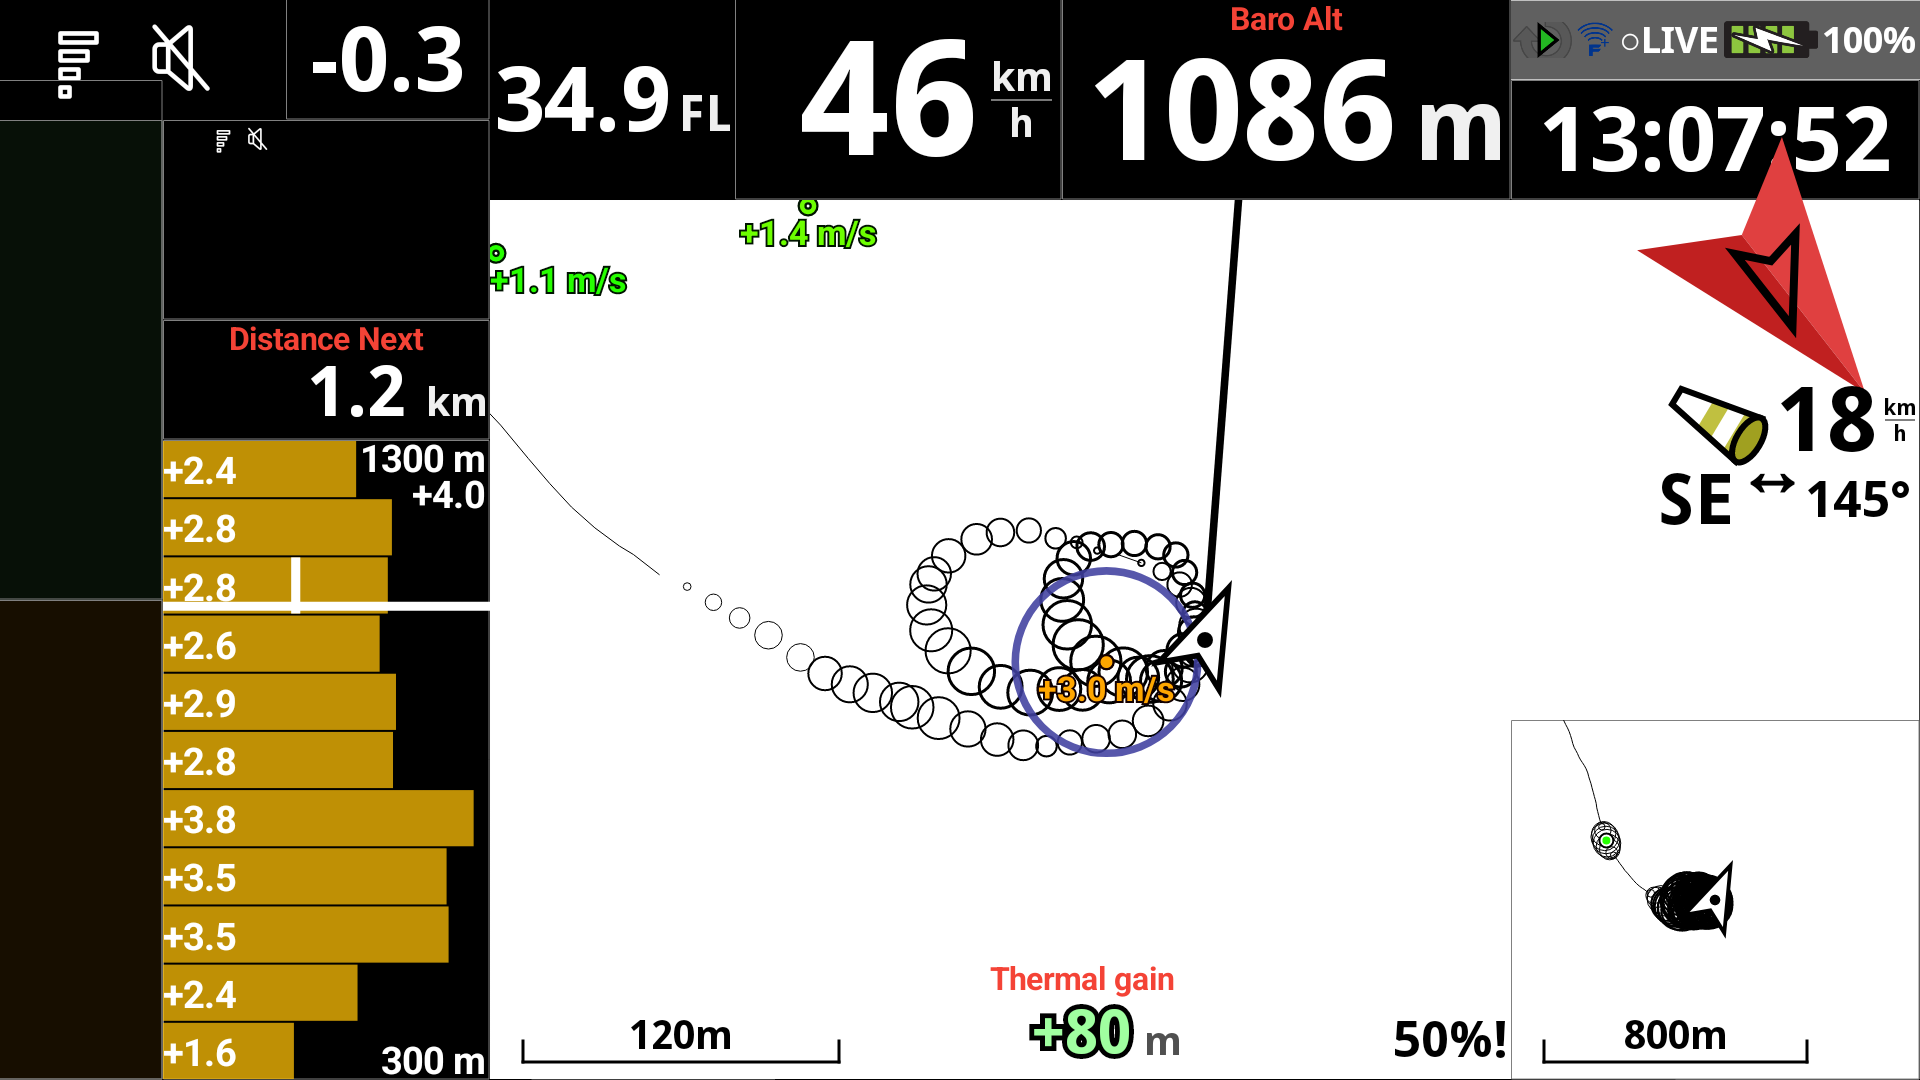


Using AIR³ for free flight, it is recommended to keep north at top, combined with the map that is moving with the wind (see “how to include wind into computation”). This gives you the best way to center the thermal or to find it back when lost.
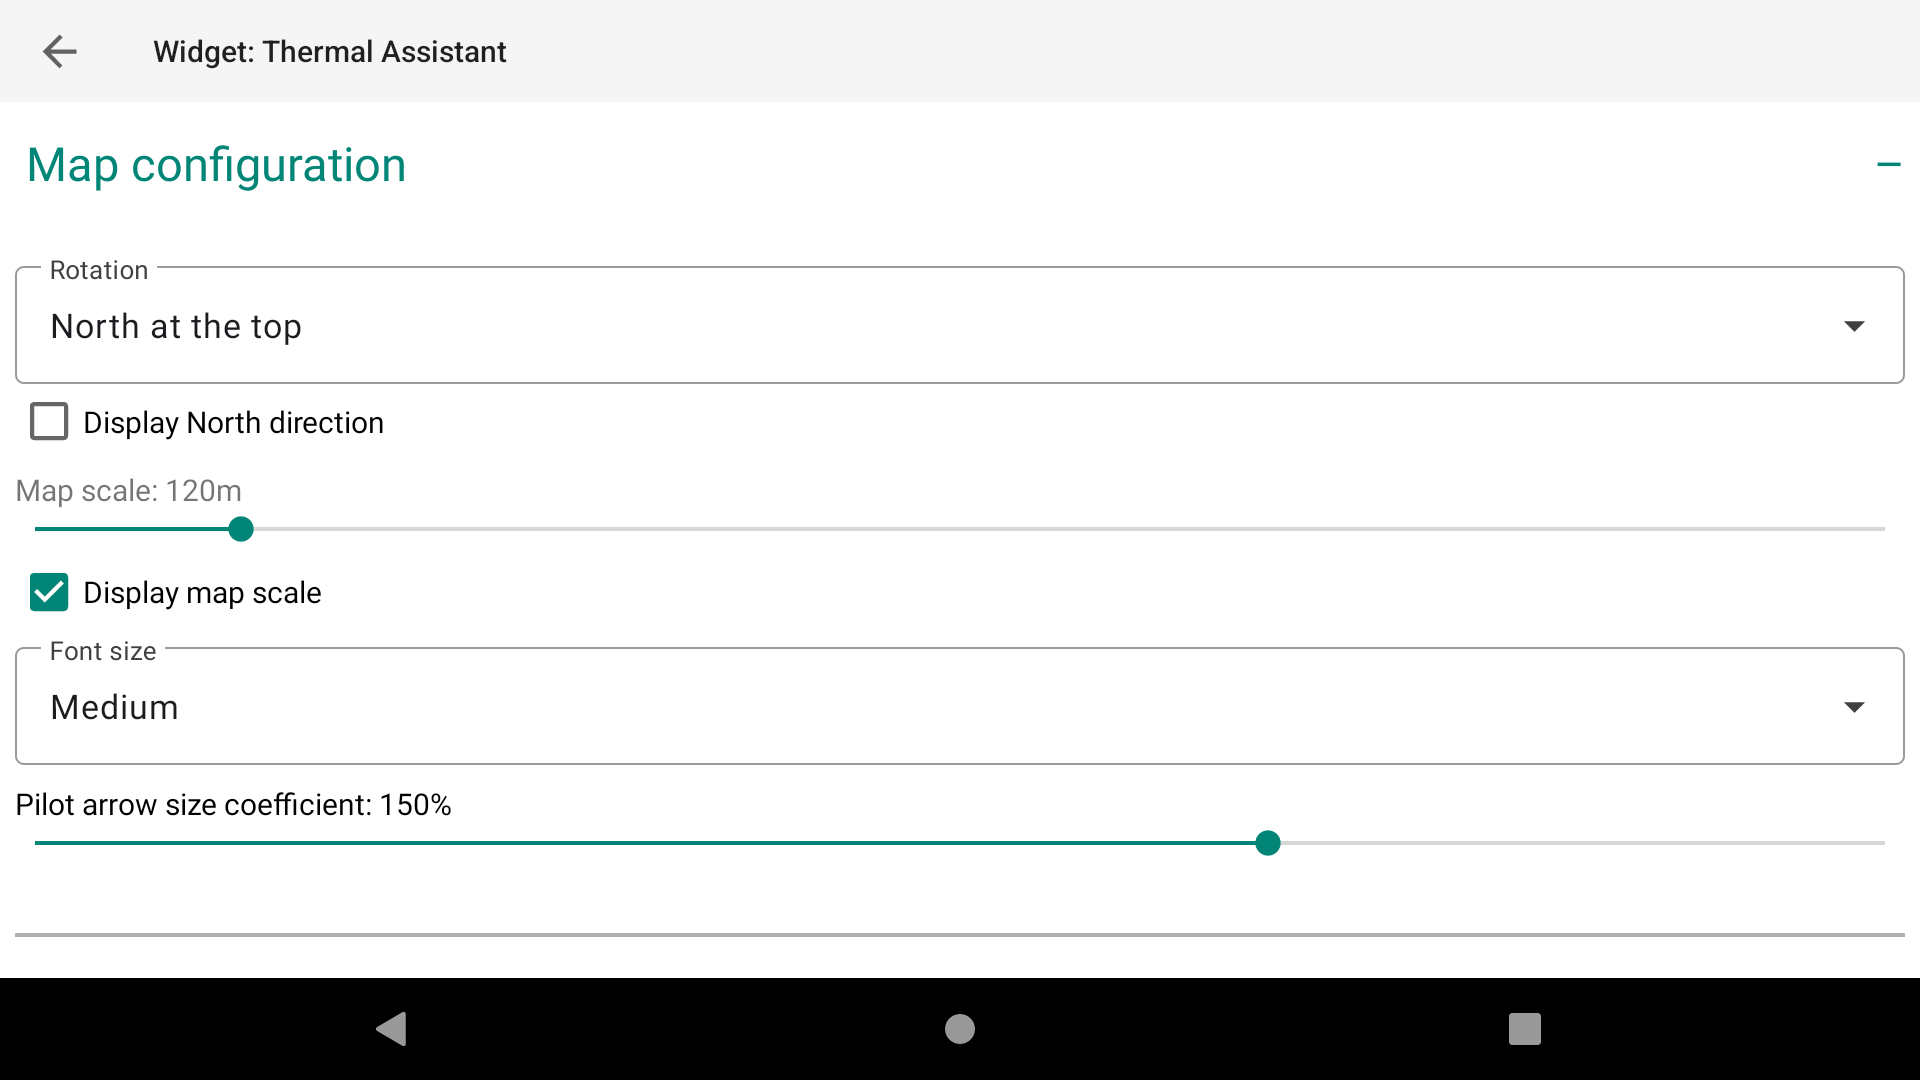
The Thermal Assistant page goal is to assist you to find thermals, not to navigate. So, it doesn’t make sense to set the top of the map with bearing or heading at top. However, as it is available for other map configuration, you can decide to change the top of the map with Navigation target at top, Bearing at top, Heading at top, Downwind direction at top or Travel direction at top .
Downwind direction at top requires to have computed the wind direction. So, in any case, the map will get North at top at the beginning of the flight. Read more details about Wind direction computation in the Wind direction widget description in the Air section page of the XCTrack Pro Widgets Manual.
Travel direction at top requires to have computed the travel direction. So, in any case, the map will get North at top at the beginning of the flight.
Travel direction gets changed when BOTH of these conditions are satisfied
– the user has traveled for more than 3 km in 20 minutes
– the user has been travelling directly for about 2 minutes
… Then, the direction is changed, with preference for the angle travelled if it doesn’t differ too much from the 2 minutes bearing.


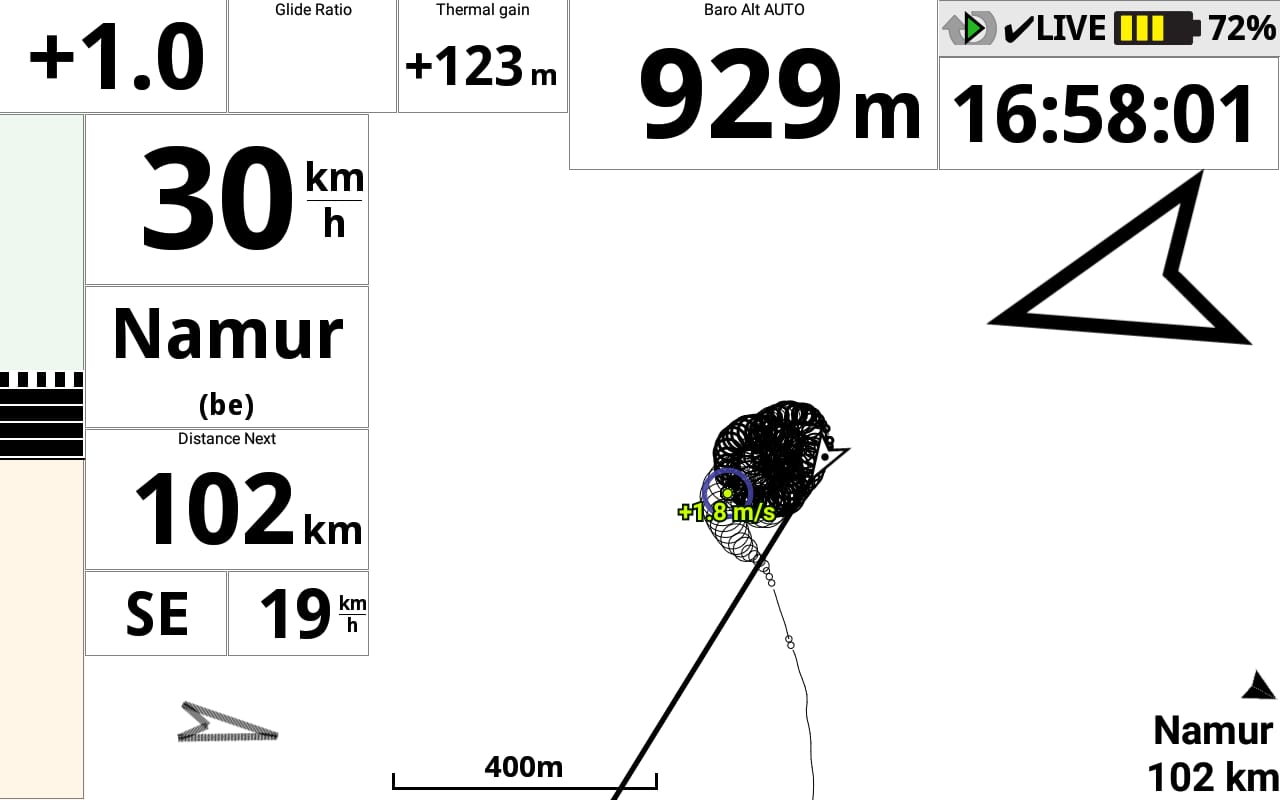
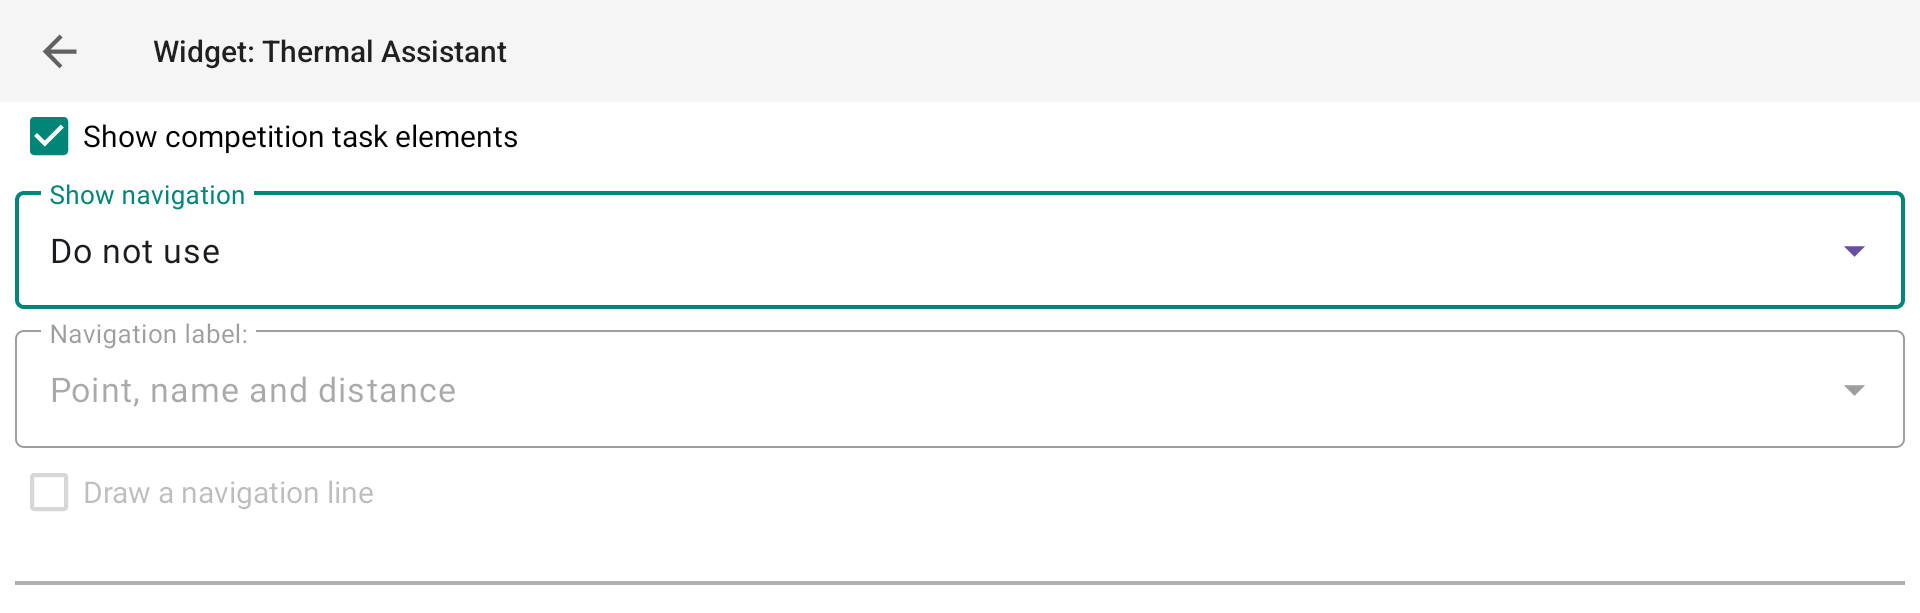
With AIR³, navigation is mainly managed by other pages. The main arrow that indicates the direction of the target is included on every page. To avoid creating confusion while trying to identify the thermal, navigation is set to "Do not use" on the Thermal Assistant widget.
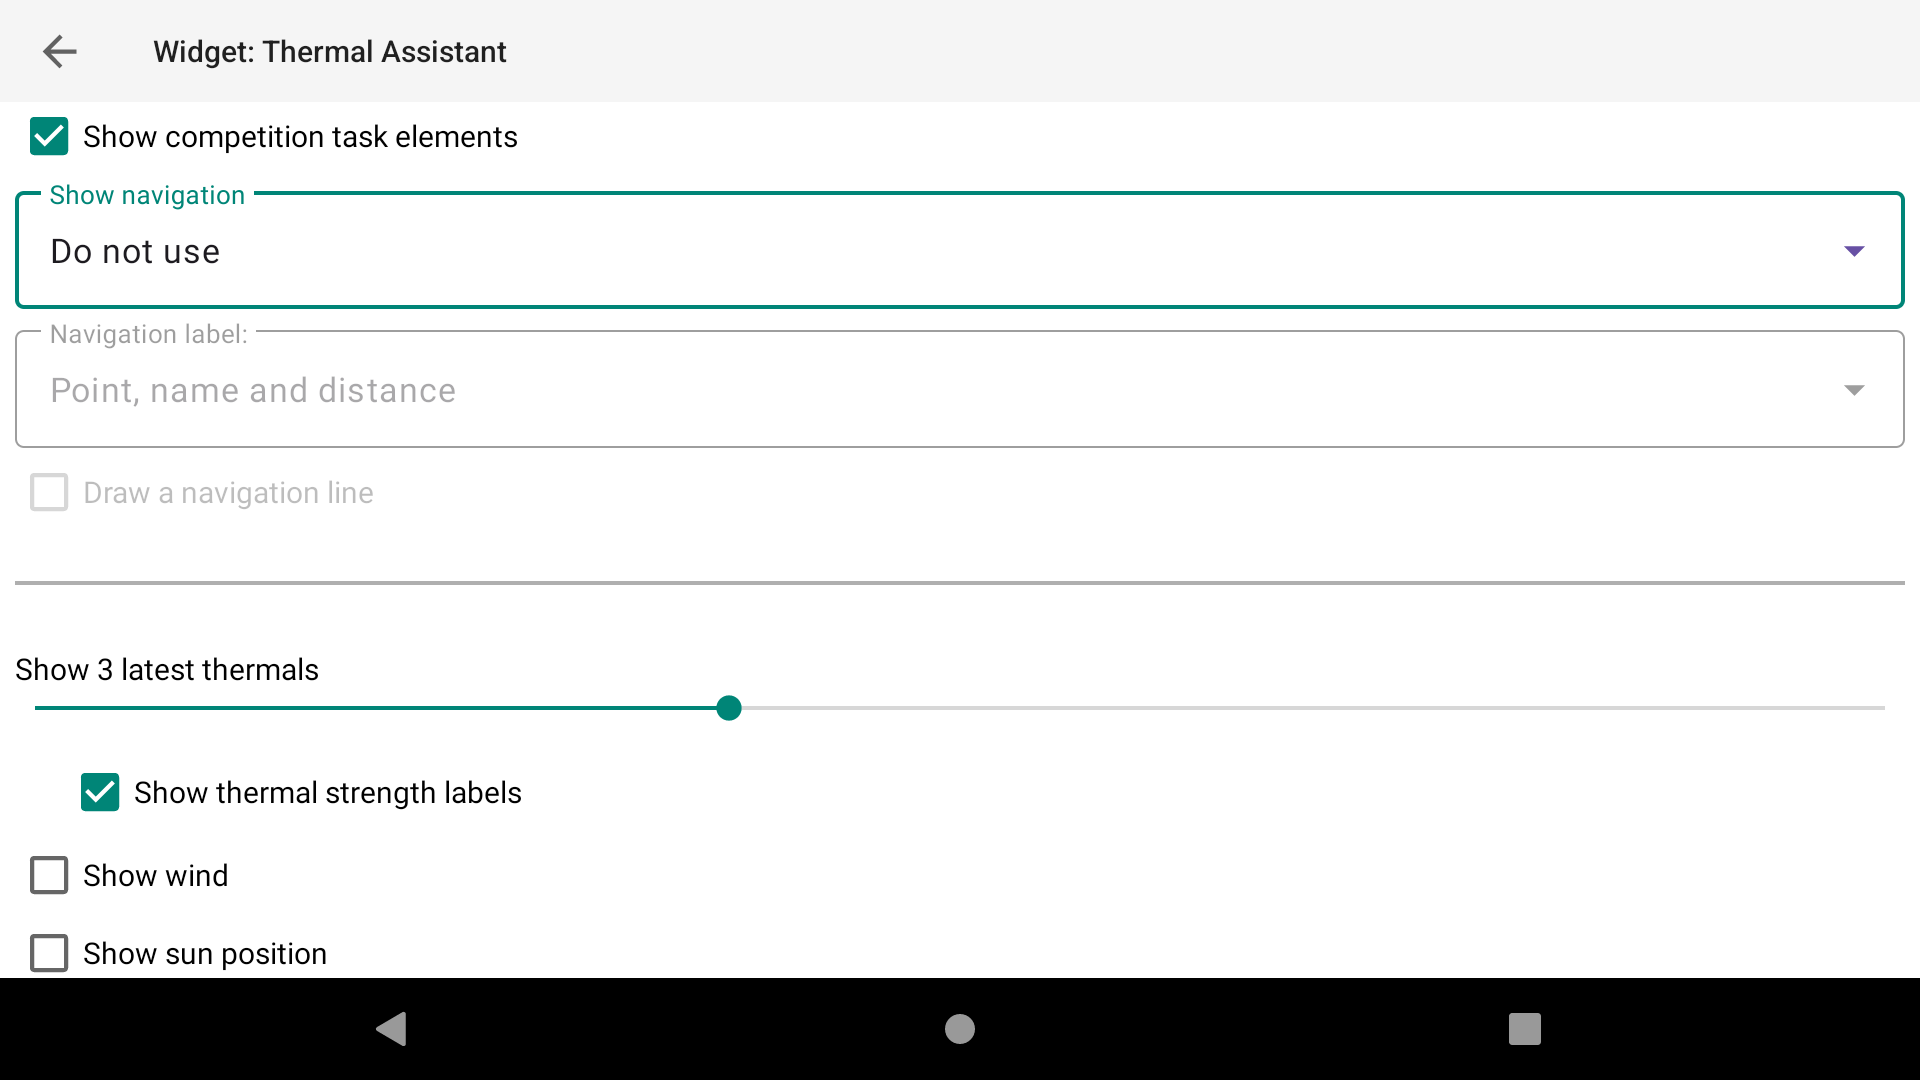
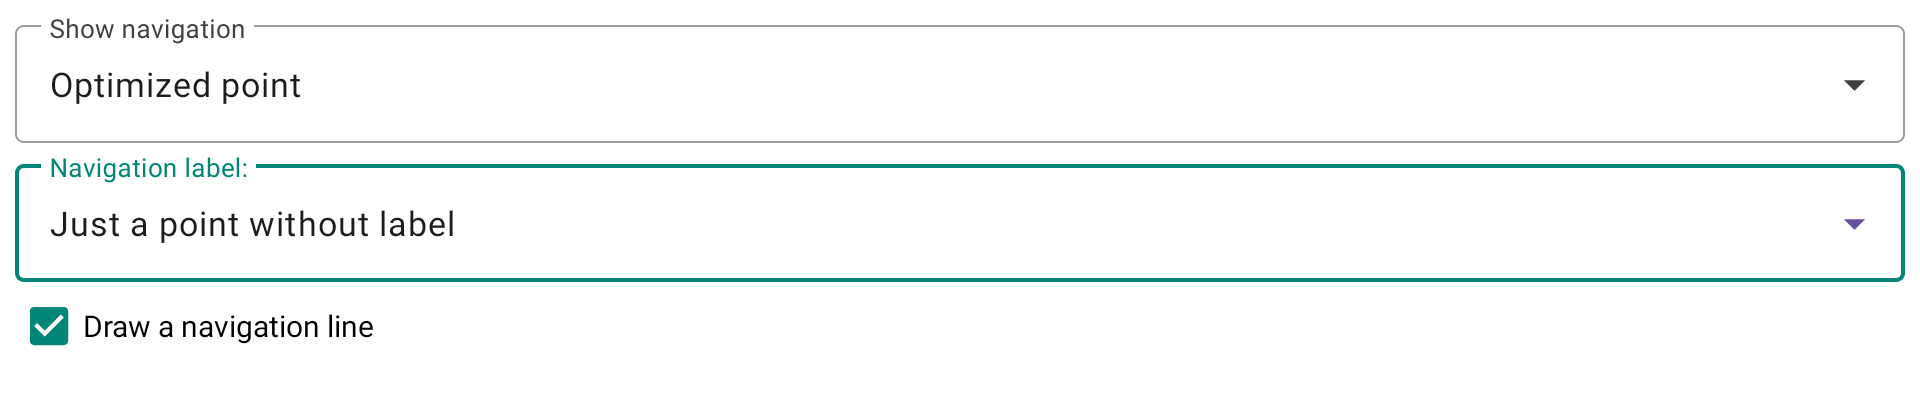
However, here are some details if you want to display navigation instructions directly on the Thermal Assistant widget. Two different options are offered:
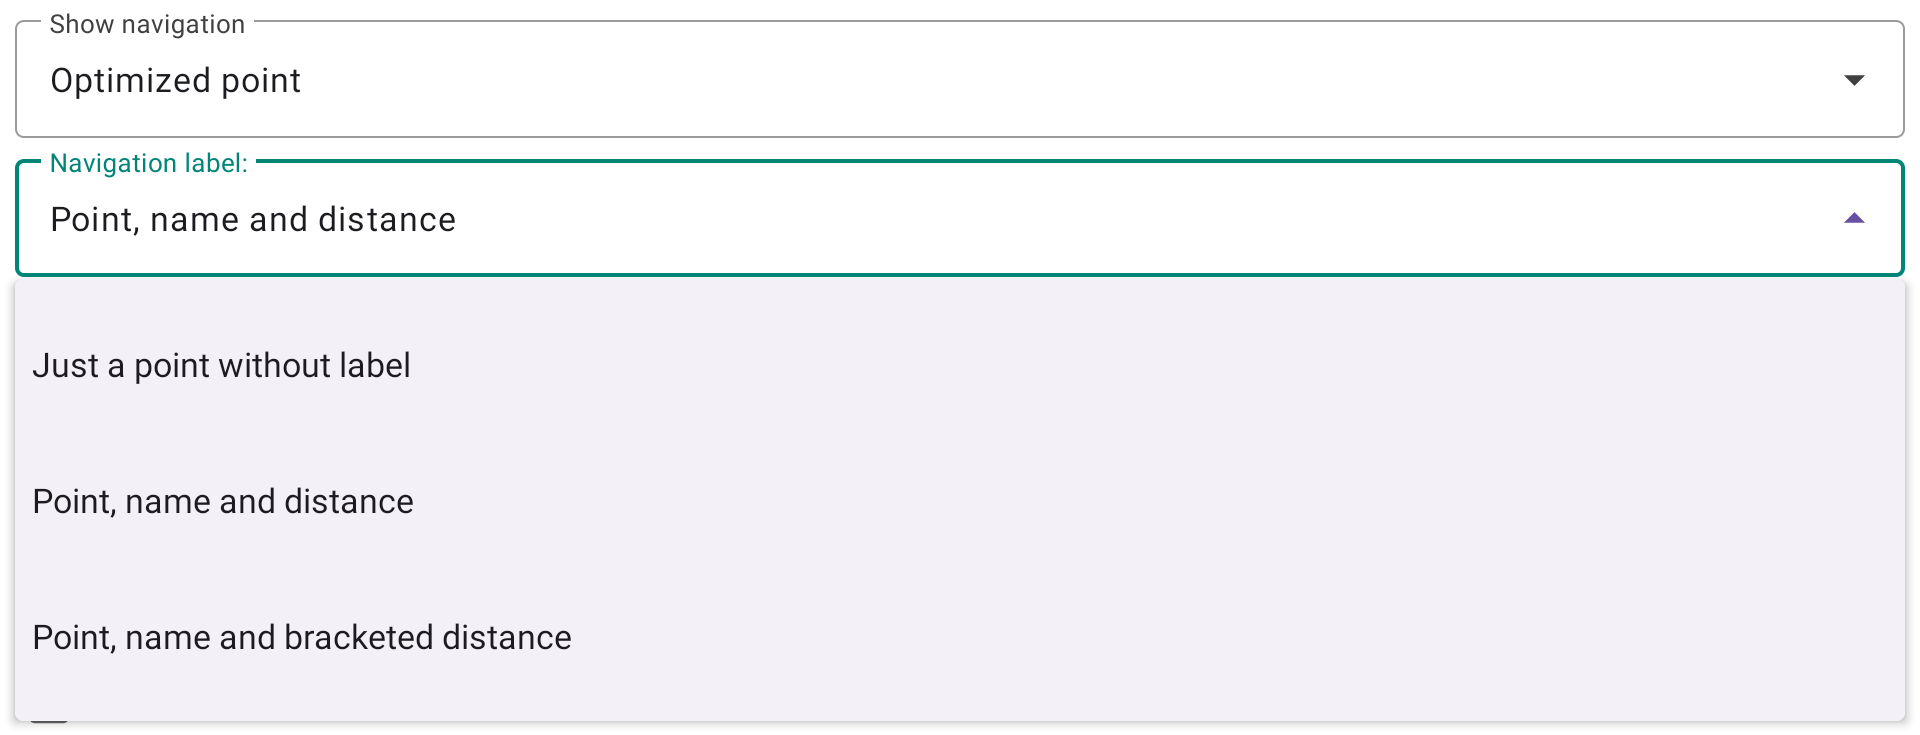
- The 'Show navigation' option allows you to select the navigation mode (point, optimised point, cylinder (nearest point) or do not use).
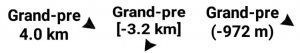
- The navigation label allows you to quickly identify your previous settings ("Just a point without label", "Point, name and distance" or "Point, name and bracketed distance").
Point mode [Optimized point] (Cylinder)
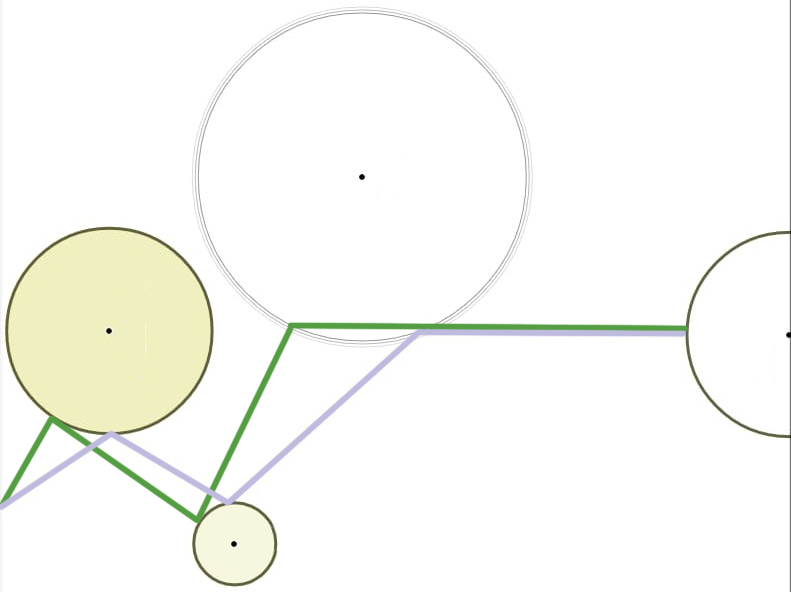
The last parameters are self explanatory.
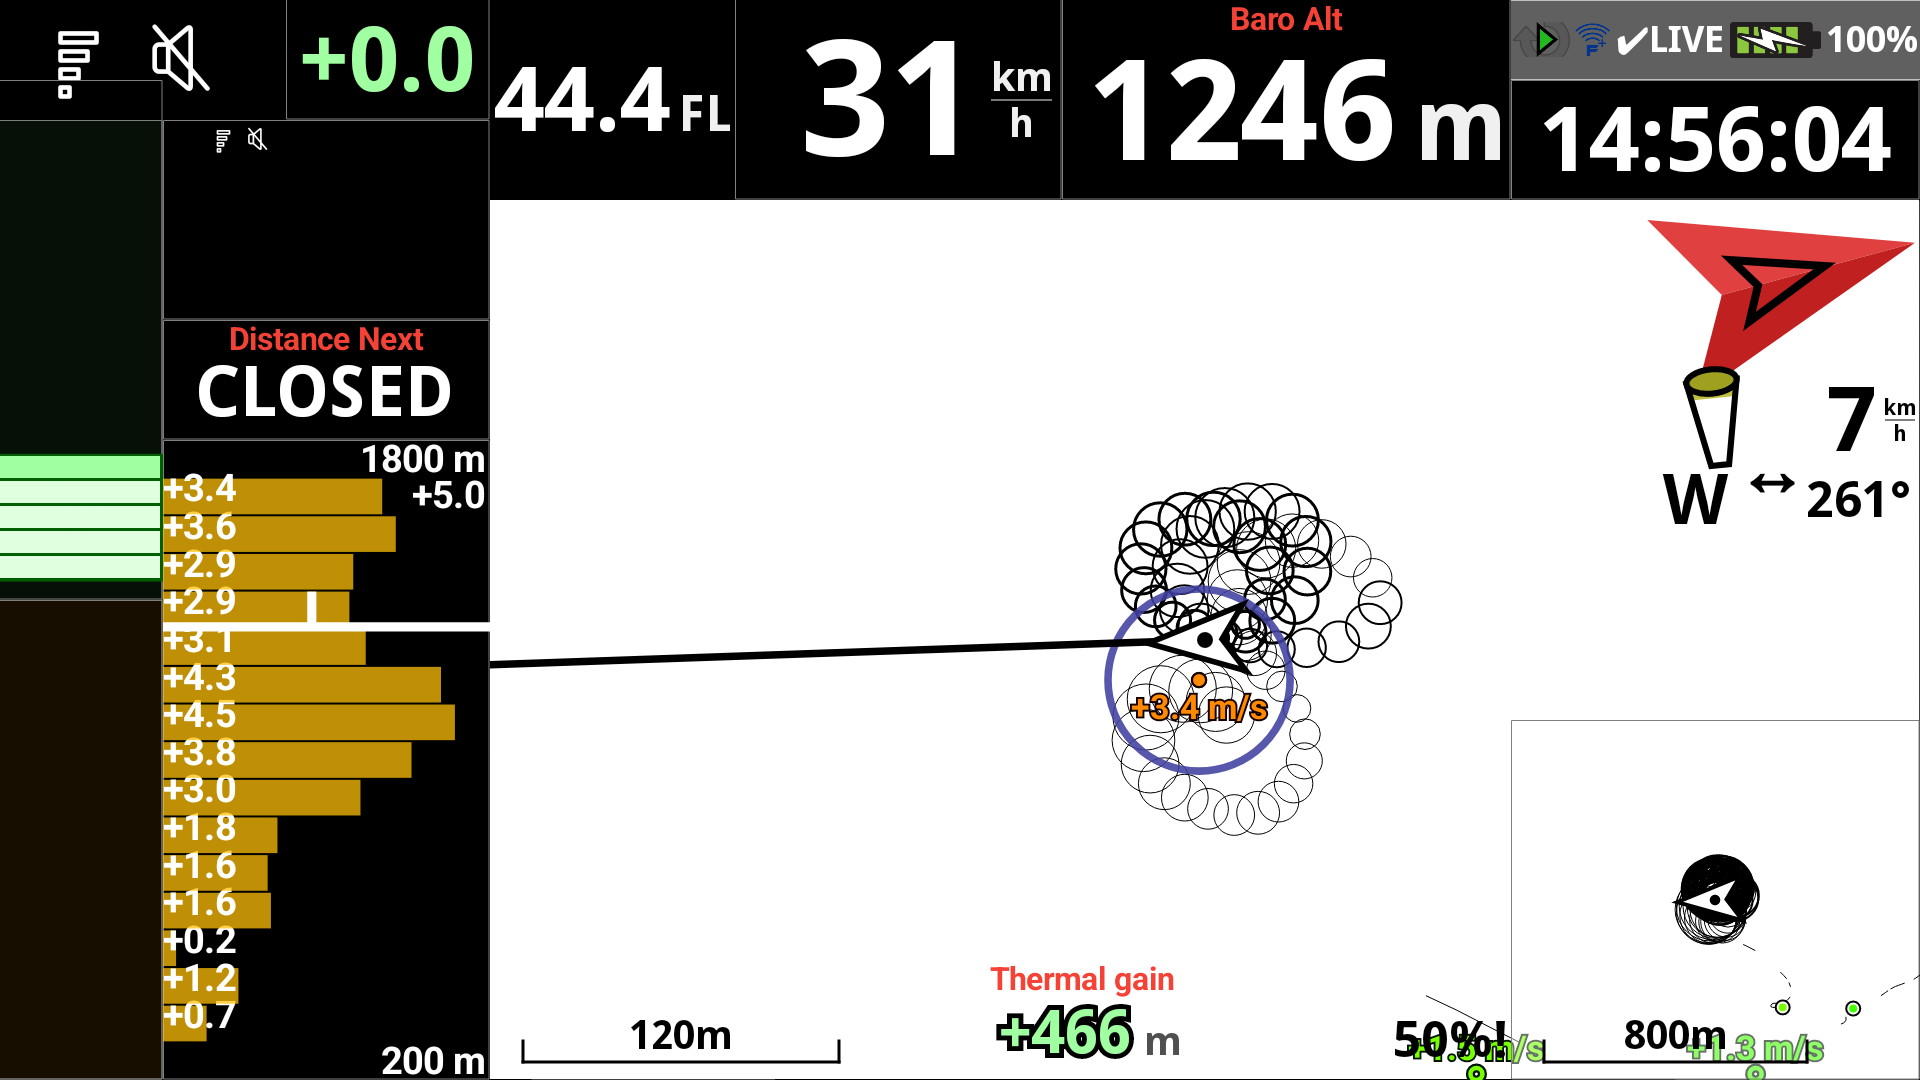
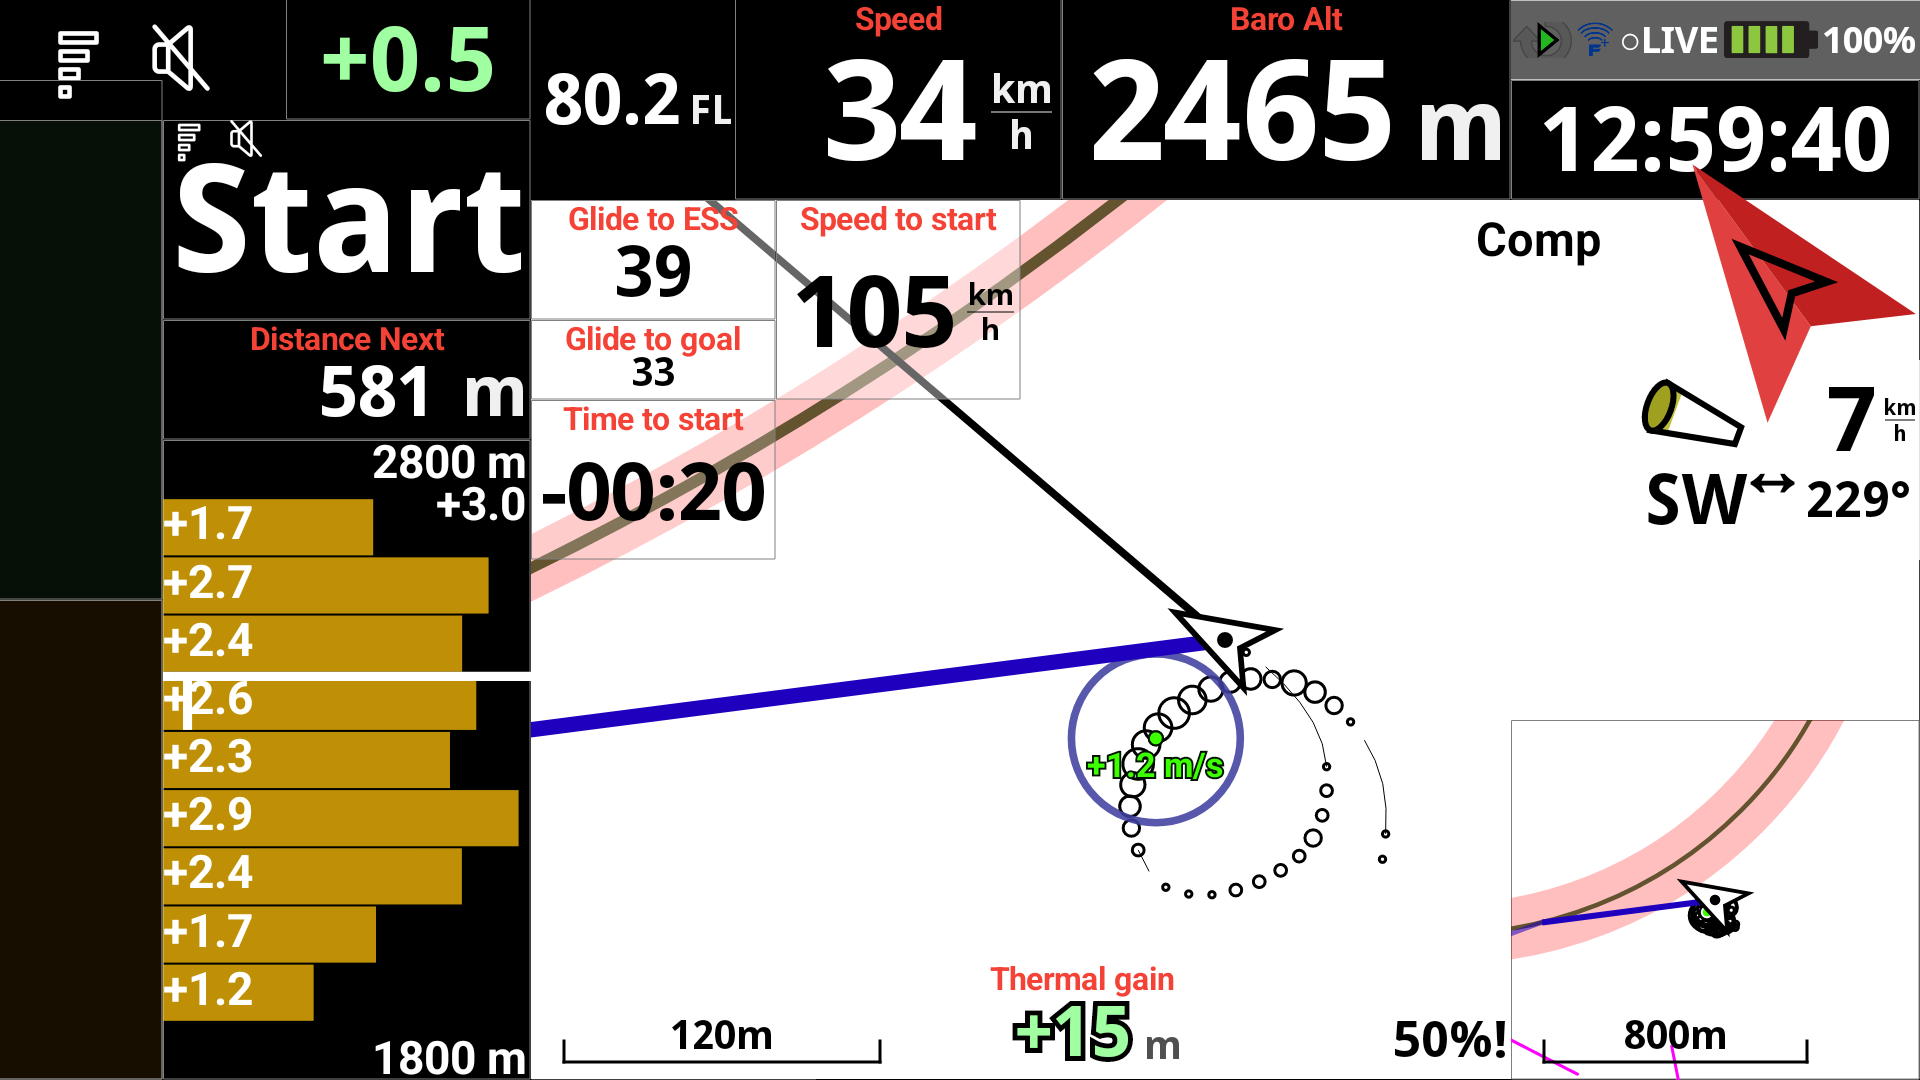
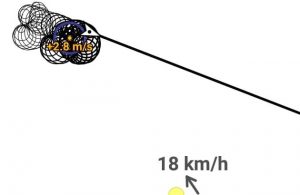
Wind is computed after completion of a full circle.
Screenshot with wind and sun position:


Next section: