This page gives details on the widgets that are in the “Navigation” subsection. They can be accessed by customizing the XCTrack Pro pages pre-installed on AIR³. Remember that your customisations will be lost if you reset XCTrack Pro interface with AIR³ Manager, if you change the profile (Kiss, Easy, Expert, Paramotor) or if you load a different configuration file ‘xcfg’.
Click on the + sign to read the details.
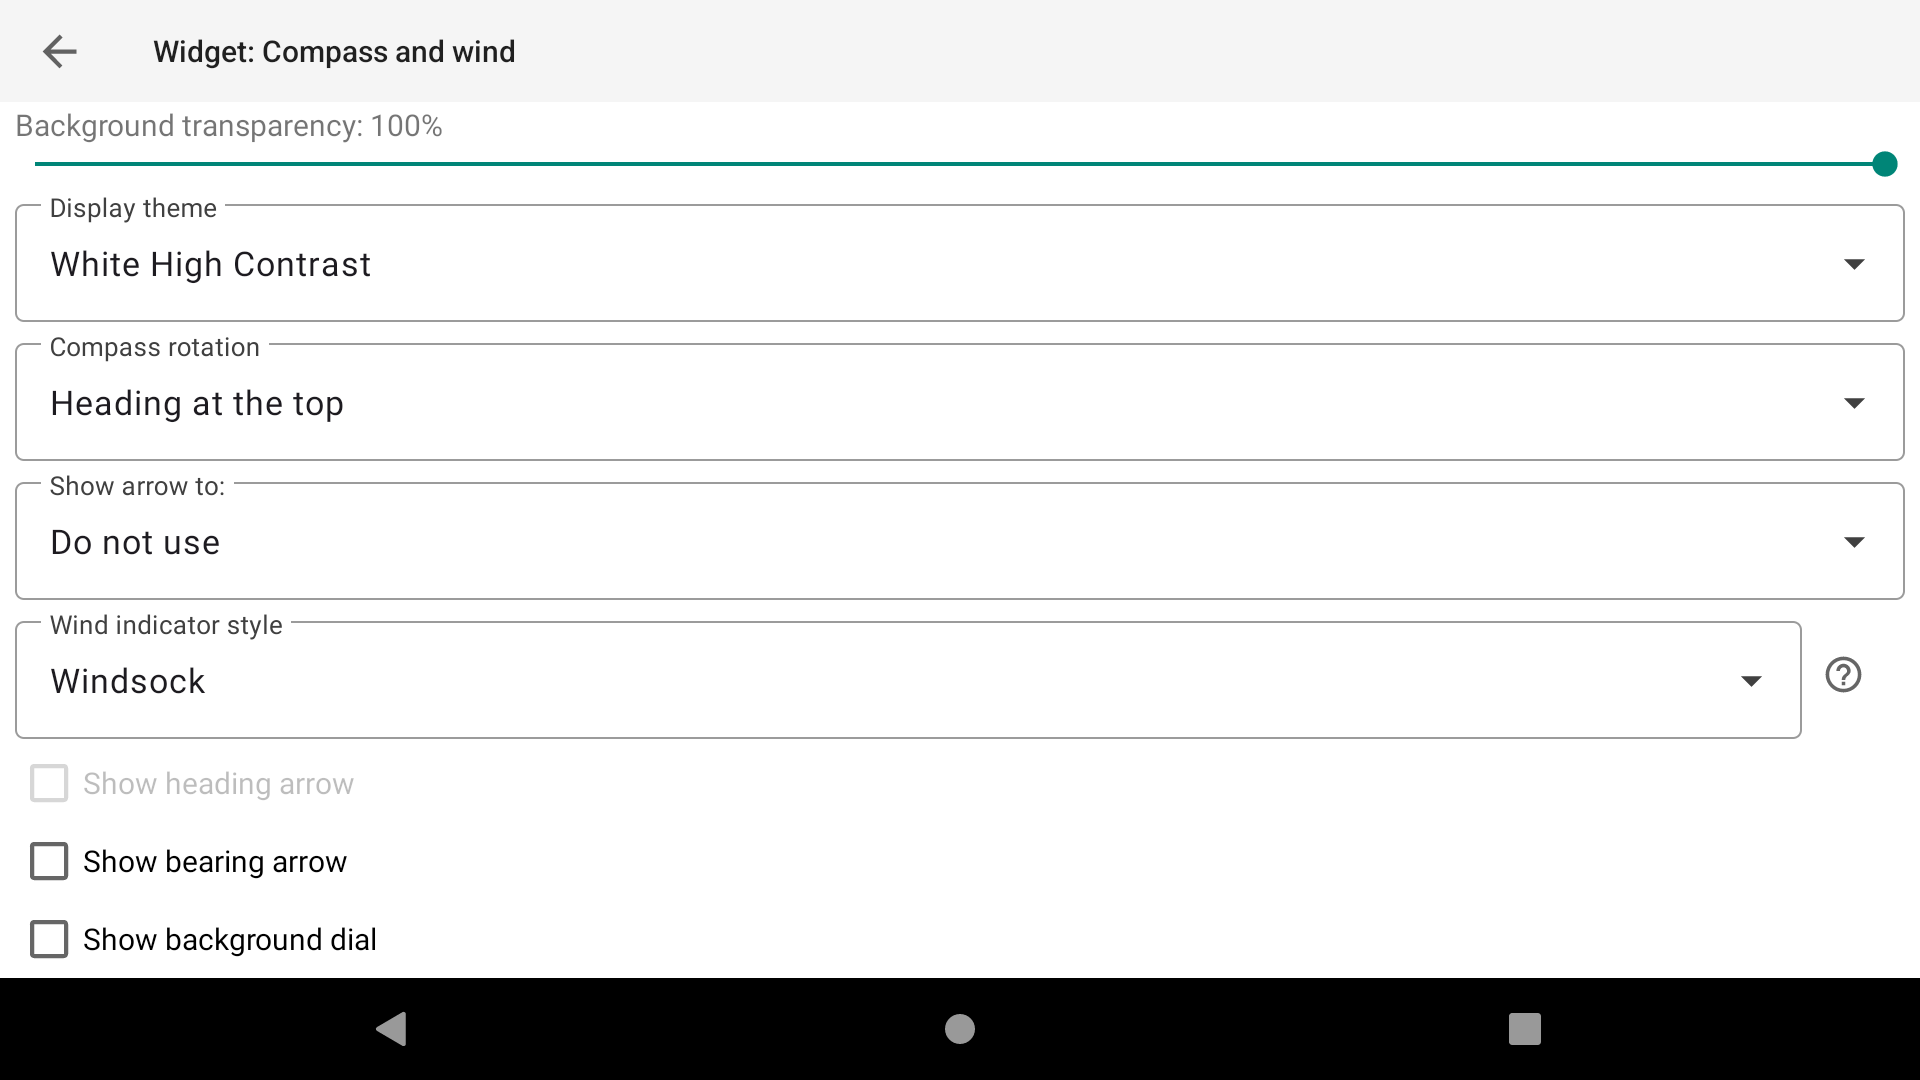
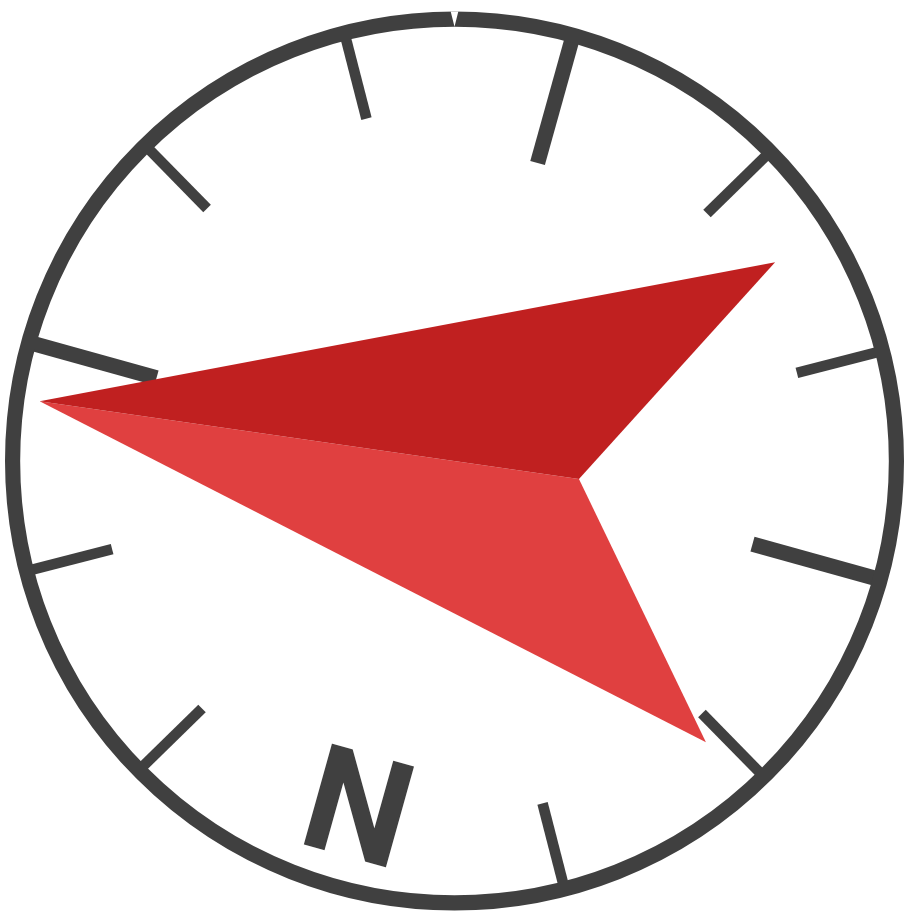
Graphical display of various direction information such as North, wind and navigation.
The widget gives you the choice of what to display:
- the target direction (see below “show arrow to”)
- the wind direction (“Wind indicator style”)
- the heading direction (“show heading arrow”)
- the bearing direction (“show bearing arrow”)
- A background dial (“show background dial”), including North.
WIND
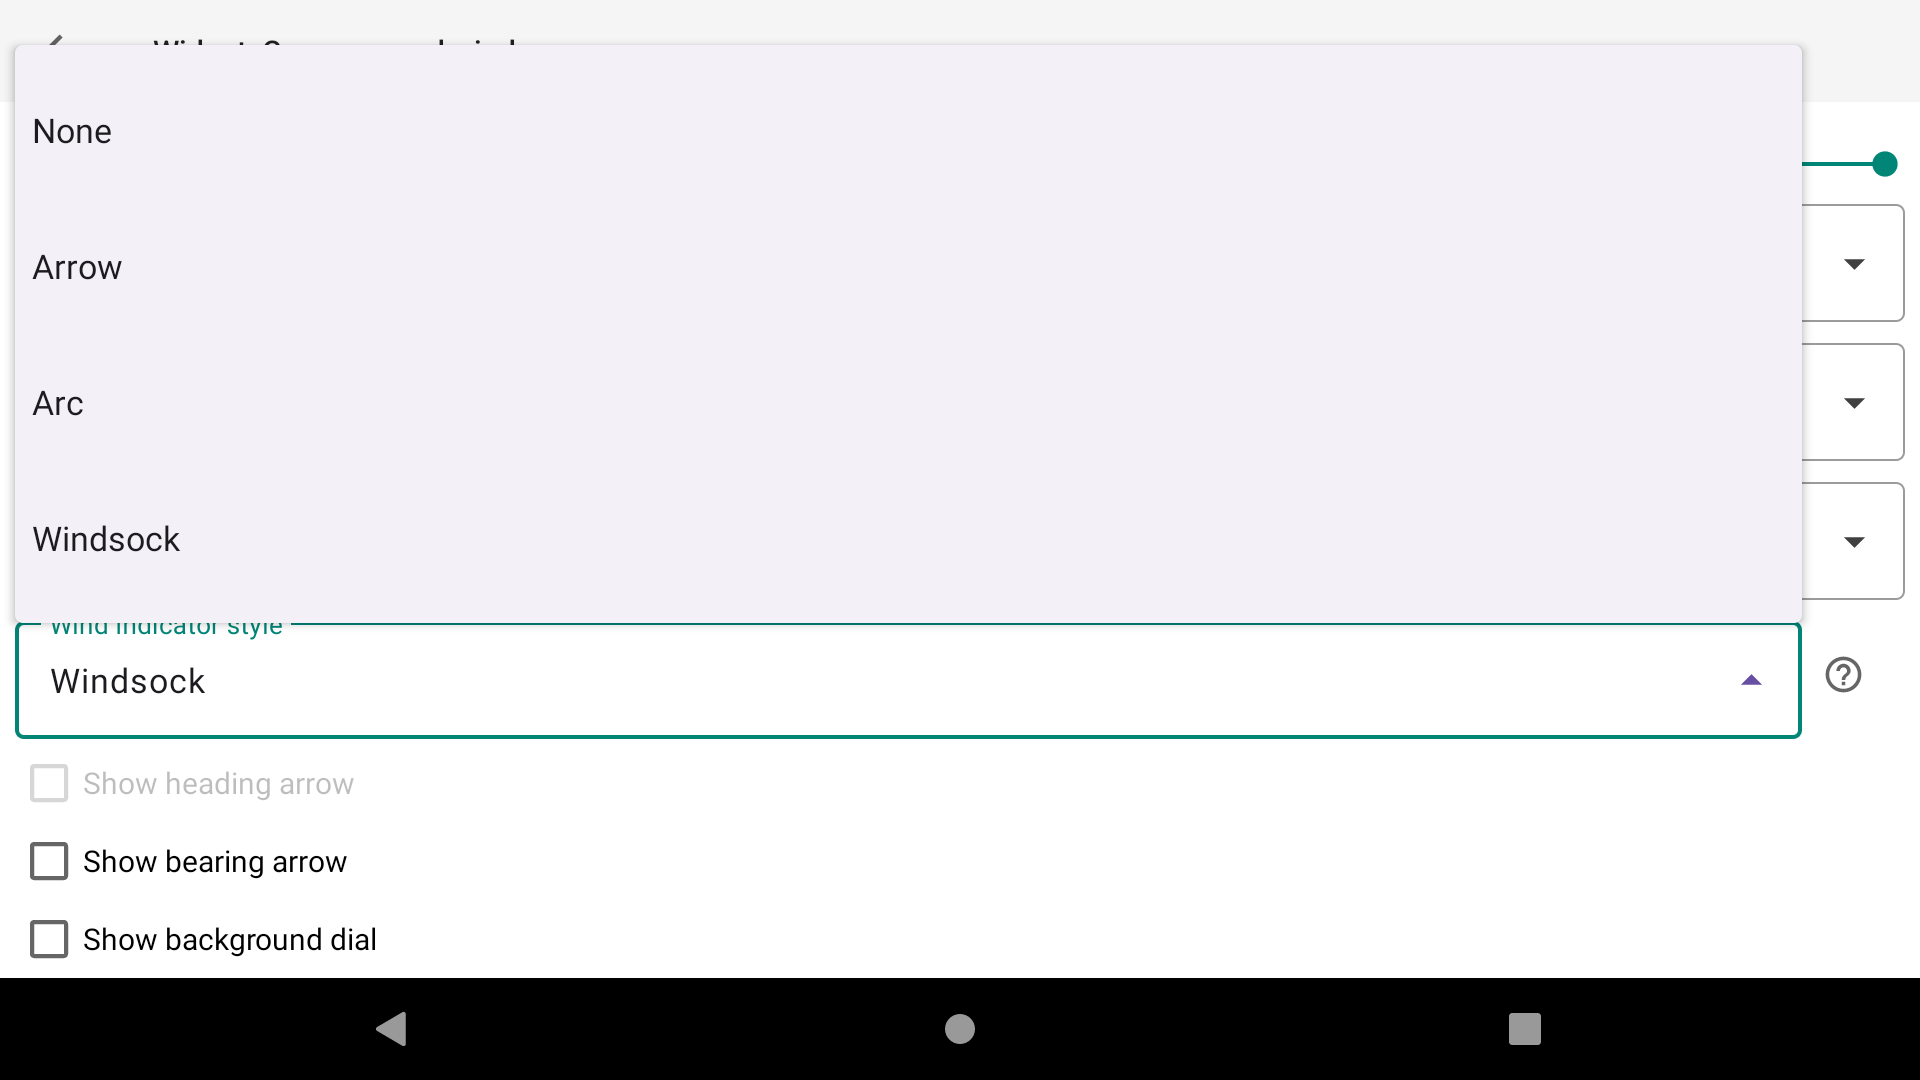
To display the wind, you have different options: arrow, arc or windsock.
Depending on the settings, you may be able to graphically determine the influence of the wind on the course.
If the pilot is flying towards the wind or against the wind, the bearing direction and the heading direction will be the same. Therefore the arrows will directly indicate the top of the compass unless you have decided to set north at top.
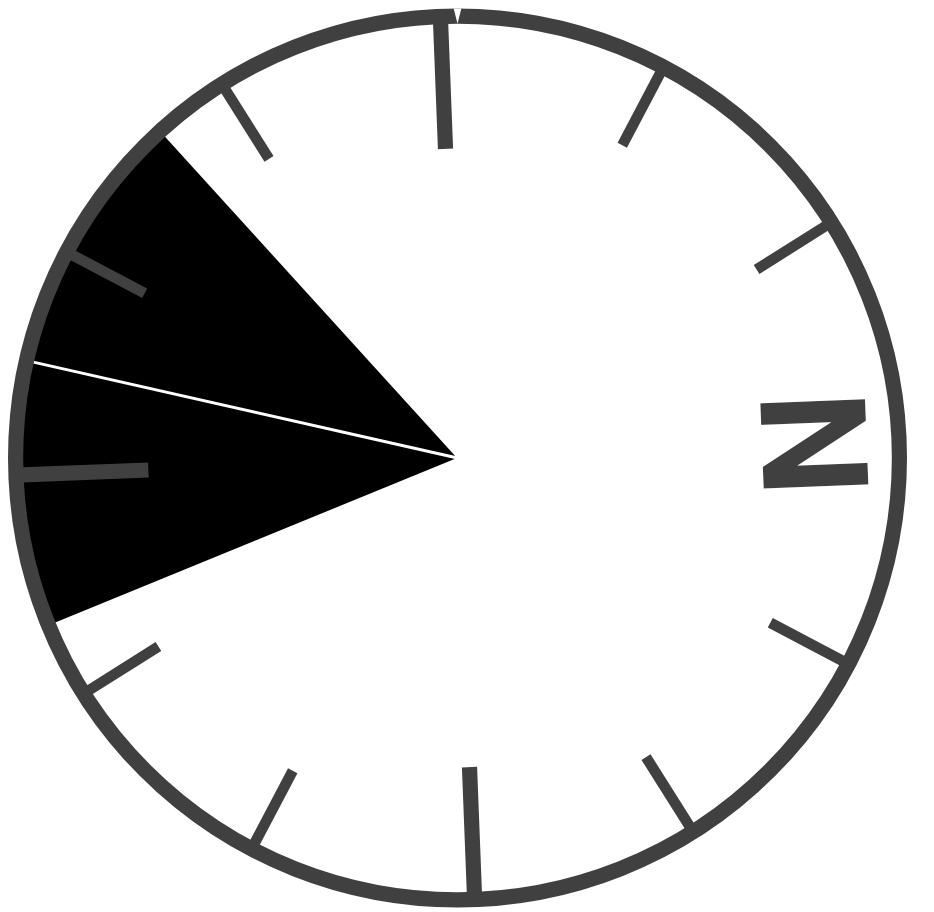
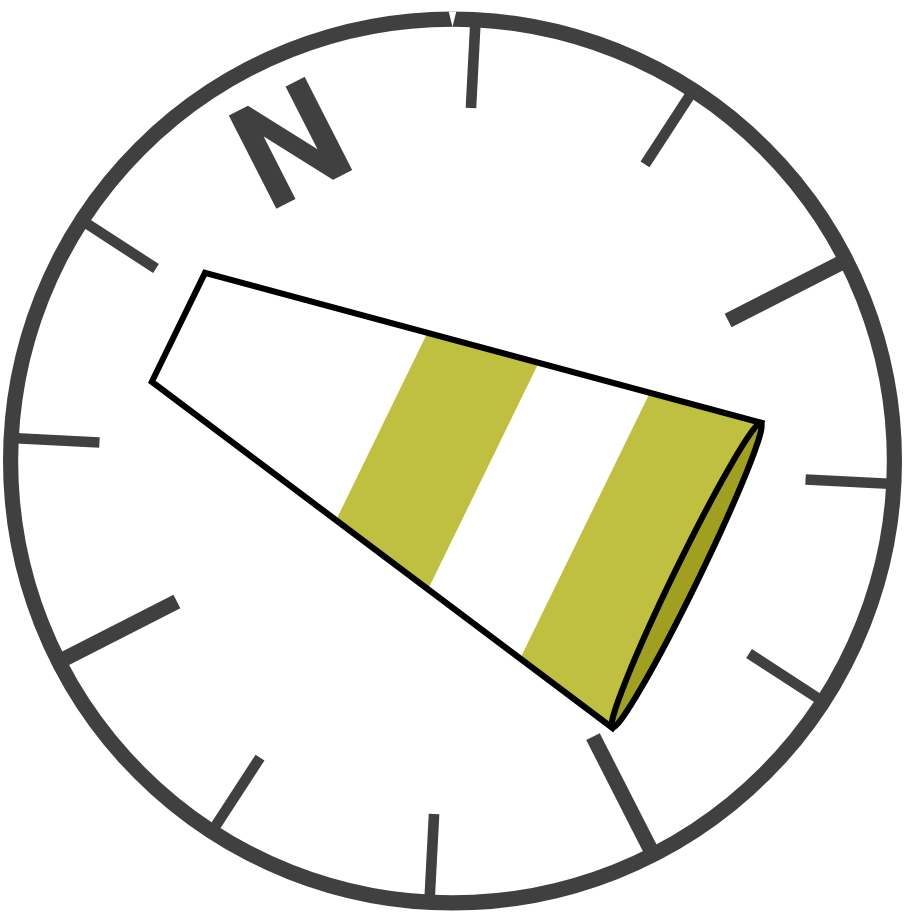
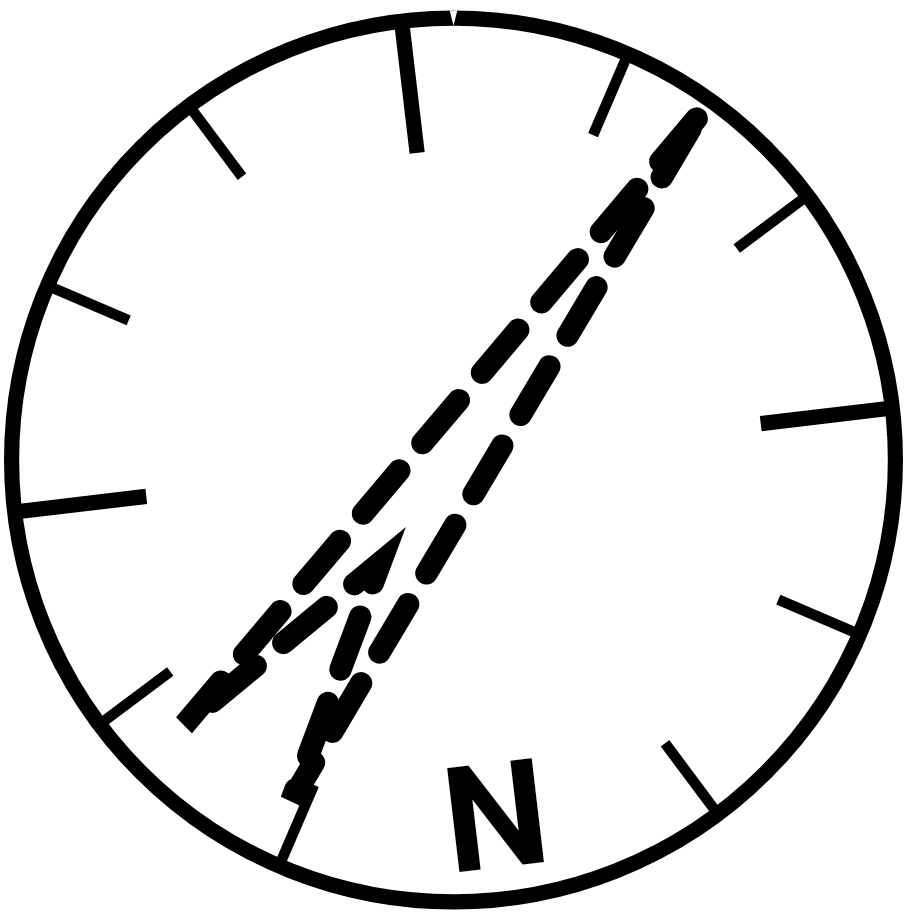
If the pilot flies at 90 ° to the wind, the stronger the wind, the greater the difference between heading and bearing direction will be. By setting up the background dial with heading at top, displaying bearing direction arrow, you will see the bearing arrow that will not indicate the top as the wind is modifying the course. The same will occur by setting up bearing at top and displaying heading direction arrow.
This compass for example is showing the bearing direction while the compass is set to have the heading at top.
By setting up north at top, you may show both heading and bearing arrow. In this case you will directly see the difference between these two arrows.


BEARING and HEADING
Here is a small reminder to better understand bearing and heading:
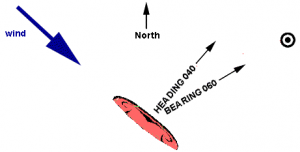
By default, XCTrack uses the Bearing/track direction thanks to the GPS, the wind speed and direction to compute the Heading direction.
By enabling “Use internal compass” in Menu/Preferences/Connection & sensors, XCTrack uses the information coming from the internal compass to display the Heading.
We do not recommend using the internal compass, which requires regular calibration to display the correct information.
Read more details on using the internal compass in the Preferences page of XCTrack Pro manual.
Depending on the theme choosen, black, white, eInk, arrows can appear in different ways:
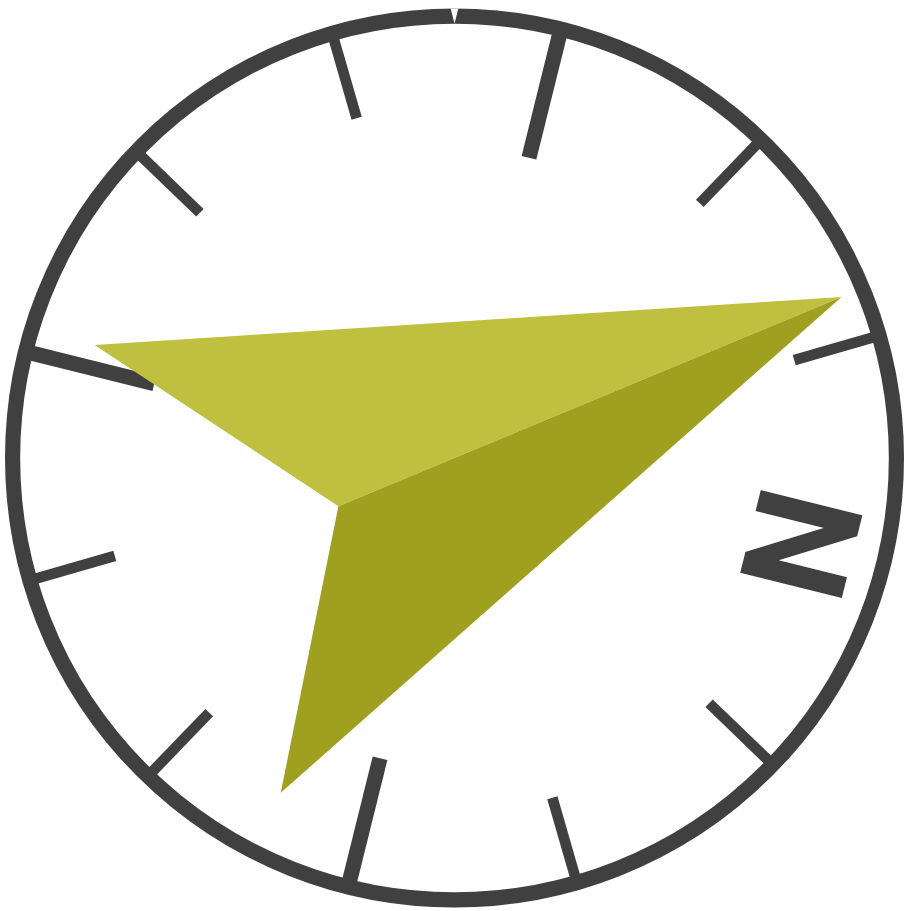
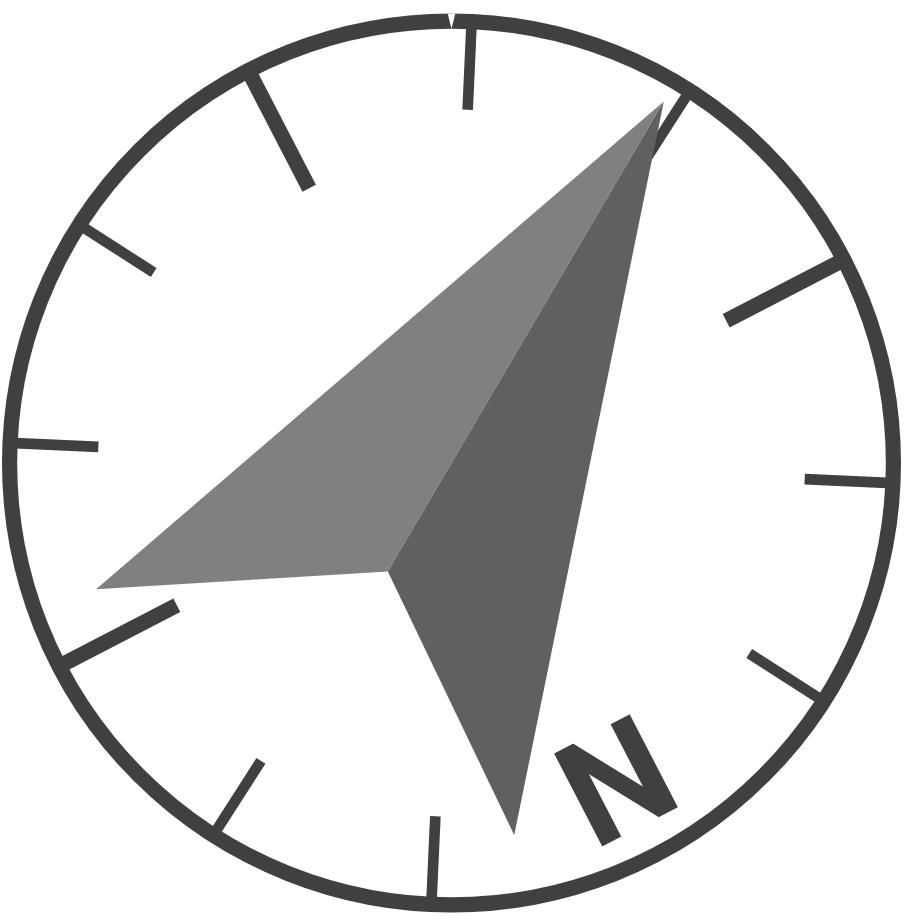
Navigation arrow to show you the direction to the target.
With background dial, unless you choose to keep north at top, the small solid triangle indicates the north direction.
eInk
White or Black
eInk

White or Black

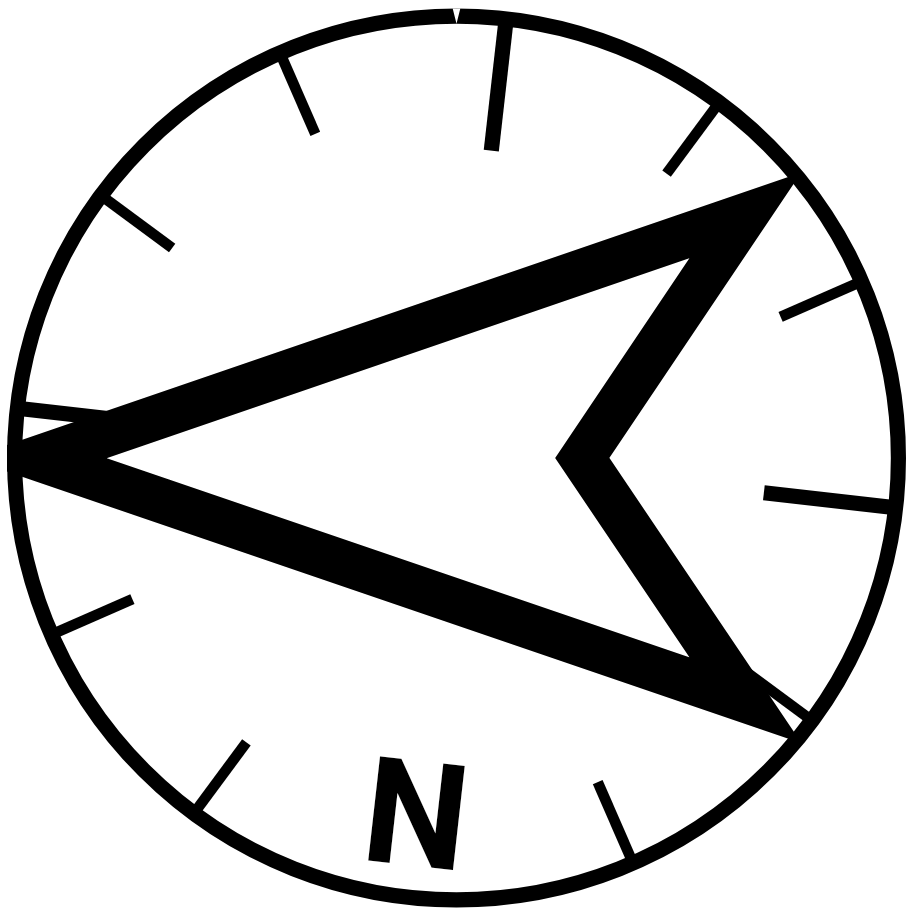
Heading or Bearing arrow
With background dial, unless you choose to keep north at top, the small solid triangle indicates the north direction.
Wind arrow
eInk
White or Black

eInk

White or Black

Once you have decided what to display, the very first thing to do is to set what is at top.
Compass rotation. Decide what you want to have at top of the compass.
- North at top is self explanatory
- Heading at top is used to always have what you have in front of you at top.
- Bearing at top is used to always have where you are going to at top.
- Travel direction at top is used to have your travel direction at top. The goal of this setting is to have less dial rotation than Bearing at top, still with the main direction where you are going to at top.Travel direction at top requires to have computed the Travel direction. So, in any case, the dial will get North at top at the beginning of the flight.
Travel direction gets changed when BOTH of these conditions are satisfied
– the user has traveled for more than 3 km in 20 minutes
– the user has been travelling directly for about 2 minutes
… Then, the direction is changed, with preference for the angle travelled if it doesn’t differ too much from the 2 minutes bearing.

With AIR³, the main arrow that indicates the direction to the target is included on every page and is set to point the Optimized point.
However, you may want to change this default setting differently.

Different settings are available for navigation depending on your preferences:
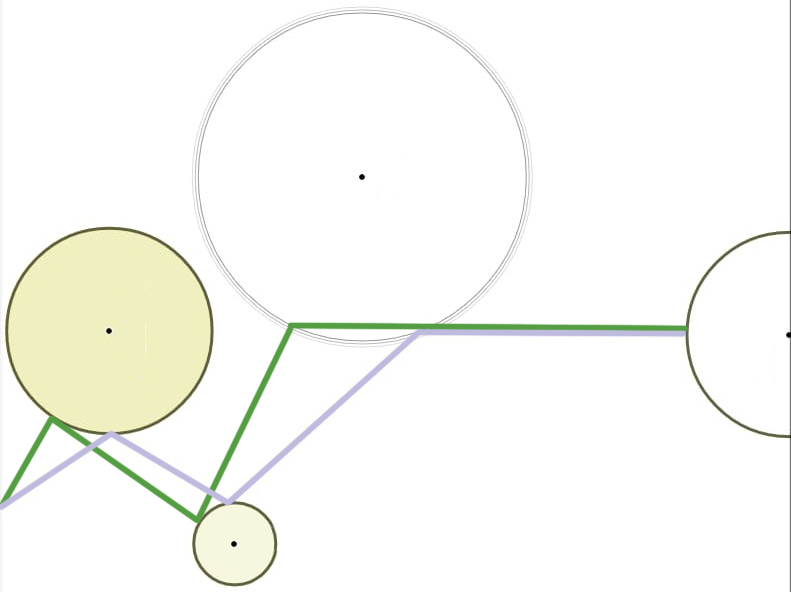
- “Point” indicates the direction to the exact target. Green line. The difference with “Cylinder” is that the distance, glide, time,etc. are calculated up to the point/target. However, once the circle around the target is reached, the navigation will switch to indicate the next point. For the Compass widget, there isn’t any difference with “Cylinder” as only the arrow is displayed.
- “Optimized point” indicates the direction to the optimized point depending on your route. This is the most used setting. Blue Line.
- “Cylinder (nearest point) indicates the direction of the nearest point of each circle once the previous is reached. Green line. The difference with the “Point” is that the distance, glide, time, etc. are calculated up to the circle to reach. For the Compass widget, there isn’t any difference with “Point” as only the arrow is displayed.
- “Do not use” is the setting to not show the arrow giving the direction (for example to only display wind direction).
The Digital Compass widget displays Bearing, Wind or Navigation as a number. The number can be computed either as an absolute value or relative to your bearing.
- Bearing indicates your current bearing, for example 0 ° if you are flying north or 180 ° if you are flying south.
- Next Turnpoint indicates the exact value to the next Turnpoint. If the next Turnpoint is exactly south of your location, the Digital Compass widget will display 180 ° if you have not chosen to calculate it “Relative to Bearing”. By selecting “Relative to Bearing”, the Digital Compass value is calculated based on your current bearing. If you are flying perfectly south (180 °) and your next Turnpoint is exactly south of your position, the Digital Compass will show 0 °.
- Wind Direction indicates the exact value of the calculated wind. The value indicates where the wind is coming from. If the wind is blowing from the south, the value will be 180 ° if you have not activated the “Relative to bearing” option. By activating the “Relative to bearing” option, you will get the calculated value based on your current bearing. With a wind coming from the south, flying exactly north, the calculated value will be 180°. If you turn around and fly south, the calculated value will be 0 °. By selecting the “Relative to bearing” option, a small arrow will show you whether the wind is blowing in the direction you are going (down arrow) or in the opposite direction you are going (up arrow).

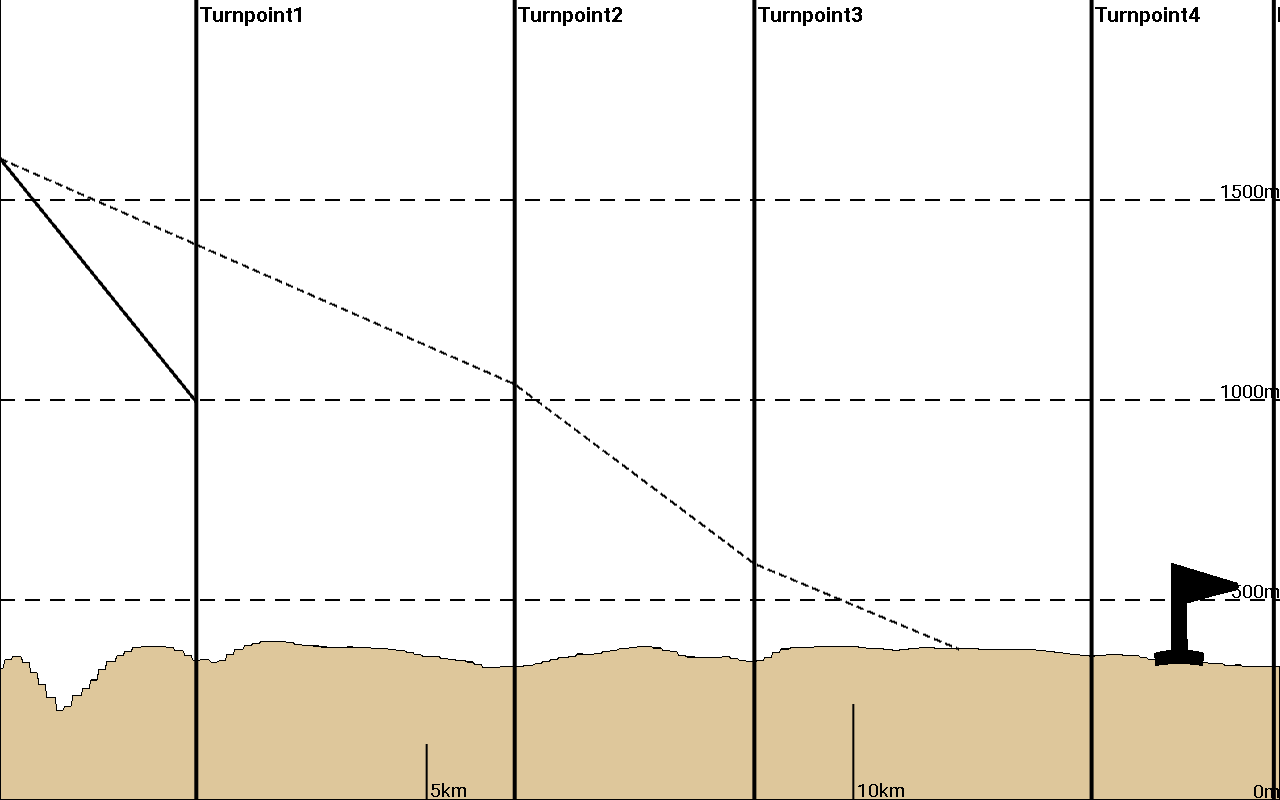
Show glide path with terrain and airspaces, going from the left of the widget to the right
The side view is integrated into the AIRSPACE page of AIR³, to give a better 3D understanding on the airspace zones in front of the pilot, but also the way the ground is evolving in front.
The second slider in the configuration of the widget determines the look-ahead distance (from 5 km to 50 km).
The third slider determines the time taken into account to average the glide ratio (from 0.1s to 1 min) to compute the solid line.

There are two types of glide lines in the side view. with a very similar behavior as the solid and the empty circle that appear when you activate the option “Mark glide distance” in map configuration. Check this option in Competition/Task Map or Xcontest/XC map),
The solid line is similar to the solid circle, based on current glide ratio (“based on reality, not valid when you climb up”).
The doted line corresponds to the empty circle, based on the configured glide ratio, trim speed and computed wind (“based on settings and computed wind”, valid either when you climb up and fly down).
Read more details about how to set these values in Menu/Preferences/Aircraft
The widget either displays the side view based on the current bearing or based on the navigation direction.
In order to switch these side view look-ahead directions, just keep your finger on the widget for 1 sec. (long press) and it will switch from one view to the other.


The “current bearing” setting means that the side view displays what is in front of the pilot, in the direction he is flying to. For example, if you are facing NorthEast with a strong NorthWest wind, flying to East NorthEast… your current bearing is East NorthEast, not NorthEast.
The widget has a small eye on the right when the side view is set on “Current bearing”.
The “navigation direction” setting means that the side view displays what is between the pilot an the next turnpoint.
The widget has a small flag on the right when the side view is set on “Navigation direction”.
Side view for better Airspace understanding.
The side view widget is very useful to get a 3D understanding of the airspace. The pilot is always on the left of the widget and can analyse the airspaces in front of him. Combining this information with the 2D map displaying airspaces (Competition/Task Map, Xcontest/XC map or AIR/Thermal assistant), the pilot can clearly understand the airspace and avoid infringing any.
Thanks to the glide lines, the pilot can also determine how to fly under the airspace zone (see below for glide lines explanations).
Read more details about Airspace setup in Menu/Preferences/Airspaces

Side view for better elevation understanding.
The side view widget is very useful to get a 3D understanding of the terrain (elevation). The pilot is always on the left side of the widget and can analyse the elevation in front of him. The glide lines allow him to fly over a given mountain pass, or check where he will land if he keeps flying the same direction.
Of course, to get such elevation information, terrain files have to be installed. AIR³ is delivered with terrain files pre-installed according to the region where it is delivered. Should you need to install others, go to Menu/Preferences/Maps/Terrain with an internet access and download the area where you are flying. For more information, watch the videos tutorial related to Maps and elevations in the videos’ page. Read more details how to setup Maps and elevation in Menu/Preferences/Maps.

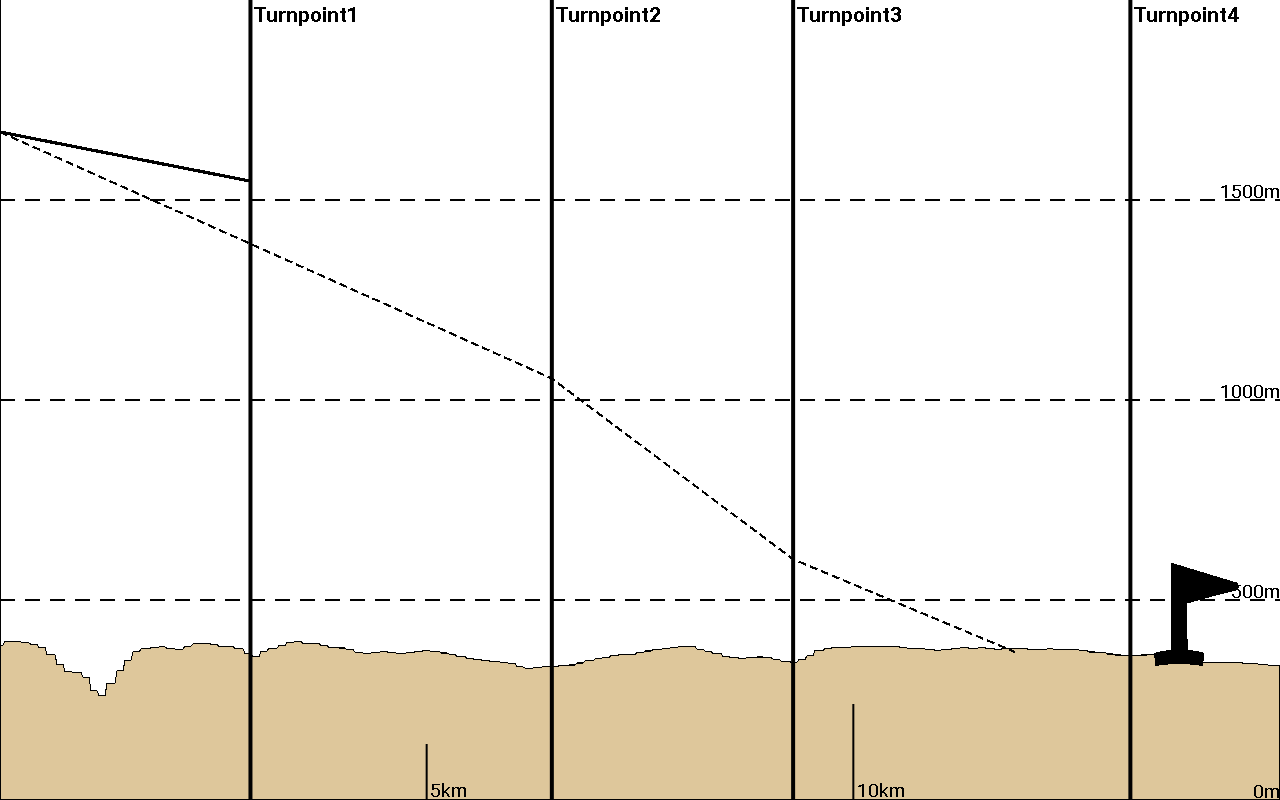
Side view for competition
The side view widget is very useful to optimize the final glide to reach the goal, thanks to a 3D understanding of the glide. The pilot is always on the left side of the widget and can analyse where exactly he will land based on the glide line.
The side view gives the competitor a better view on the turnpoints and goal to reach, together with the glides. The vertical lines correspond to the “Optimized point” of the cylinder of the remaining turnpoint(s) and/or Goal.
Read above for solid and doted lines explanations. As the solid line is based on the current glide ratio, only the first leg makes sense for the pilot. The current glide ratio will definitly be different once the next turnpoint will be reached, unless the next turnpoint is in the same direction. The glide slope with doted lines is the theorical slope according to settings and current wind. This line is taking into account the wind direction and its strength, so it is a good indication for the pilot to optimize his flight. Once the last leg is the one for Goal, the solid line is even more useful.
Name of the next turnpoint.
Read more details about how to setup your waypoints in Menu/Navigation

Distance to the next turnpoint
The value is computed based on the route either to the Point, [Optimized point] … or based on the nearest point (cylinder).
You can Activate “Use distinguishing brackets” in order to quickly identify your previous settings: Point [Optimized point] (Cylinder)
Reminder:
- “Point” indicates the exact target. The difference with “Cylinder” is that the distance, glide, time,etc. are calculated up to the point/target. However, once the circle around the target is reached, the navigation will switch to indicate the next point.
- “Optimized point” takes into account the route to the optimized point. This is the most used setting
- “Cylinder (nearest point) takes into account the route to the nearest point of the start circle.
Point
Optimized point
Cylinder


Time of arrival to the next turnpoint
The value is computed either based on the route to the Point, [Optimized point] … or based on the nearest point (cylinder).
You can Activate “Use distinguishing brackets” in order to quickly identify your previous settings: Point [Optimized point] (Cylinder)
Reminder:
- “Point” indicates the exact target. The difference with “Cylinder” is that the distance, glide, time,etc. are calculated up to the point/target. However, once the circle around the target is reached, the navigation will switch to indicate the next point.
- “Optimized point” takes into account the route to the optimized point. This is the most used setting
- “Cylinder (nearest point) takes into account the route to the nearest point of the start circle.

Speed used for computation. You can choose between Groundspeed, Airspeed with wind compensation, Glide speed with wind compensation, XC speed.
Groundspeed: your actual speed over ground is used. If you fly toward the point, you will see how much time it takes (the wind is included implicitly), but if you are circling, the value will change all the time because of the different ground speed upwind and downwind.
Airspeed: see Airspeed widget info in the Flying section. Airspeed is computed based on groundspeed and computed wind. It is the speed that would have been indicated if the pilot had a airspeed sensor (tube). It actually depends on your braking/accelerating position. The value computed is the time when you reach the point in the current breaking/accelerating settings. If you fly directly (but you don’t need to do it), this is the difference between ground speed and airspeed.
Glidespeed: the speed from glider configuration corrected by wind. It doesn’t matter how fast you are flying right now nor direction. It indicates when you reach the point if you fly directly and on configured airspeed (for example full accelerated flight speed).
XC speed: Time calculated on the speed based from the biggest xc distance (distance over 3 breaking point) and the flying time. Can be used for large FAI triangle hunting.
Based on the setting, speed can vary very much. The “averaging interval” gives the opportunity to compute based on average interval.
Finally, you can decide which format you want to display the Time …


Height or altitude of arrival to the next turnpoint
The value is computed either based on the route to the Point, [Optimized point] … or based on the nearest point (cylinder).
You can Activate “Use distinguishing brackets” in order to quickly identify your previous settings: Point [Optimized point] (Cylinder)
Reminder:
- “Point” indicates the exact target. The difference with “Cylinder” is that the distance, glide, time,etc. are calculated up to the point/target. However, once the circle around the target is reached, the navigation will switch to indicate the next point.
- “Optimized point” takes into account the route to the optimized point. This is the most used setting
- “Cylinder (nearest point) takes into account the route to the nearest point of the start circle.

Speed used for computation. You can choose between Groundspeed, Airspeed with wind compensation, Glide speed with wind compensation, XC speed.
Groundspeed: your actual speed over ground is used. If you fly toward the point, you will see how much time it takes (the wind is included implicitly), but if you are circling, the value will change all the time because of the different ground speed upwind and downwind.
Airspeed: see Airspeed widget info in the Flying section. Airspeed is computed based on groundspeed and computed wind. It is the speed that would have been indicated if the pilot had a airspeed sensor (tube). It actually depends on your braking/accelerating position. The value computed is the time when you reach the point in the current breaking/accelerating settings. If you fly directly (but you don’t need to do it), this is the difference between ground speed and airspeed.
Glidespeed: the speed from glider configuration corrected by wind. It doesn’t matter how fast you are flying right now nor direction. It indicates when you reach the point if you fly directly and on configured airspeed (for example full accelerated flight speed).
XC speed: Time calculated on the speed based from the biggest xc distance (distance over 3 breaking point) and the flying time. Can be used for large FAI triangle hunting.
Based on the setting, speed can vary very much. The “averaging interval” gives the opportunity to compute based on average interval.
Shown value can be:
- AGL: Altitude above Ground Level
- AMSL: Altitude above Mean Sea Level
- Altitude drop: The altitude that a pilot loses during the journey to the next tp
The value is computed on actual destination (for example on the cylinder, if you pick Cylinder or Optimized point described above).

Next section: