This page gives additional details on the widgets that are in the “Competition” subsection. They can be accessed by customizing the XCTrack Pro pages pre-installed on AIR³. Remember that your customization will be lost if you reset XCTrack Pro interface with AIR³ Manager, if you change the profile (Kiss, Easy, Expert, Paramotor) or if you load a different configuration file ‘xcfg’.
Read more details about competition in Menu/Navigation/Competition of the main XCTrack Manual.
Click on the + sign to read the details.
In the Optional map layers section, you can overlay additional data layers on top of the map.
Rain radar (Pro)
When enabled, displays live rain radar data as an overlay on the map, allowing you to anticipate precipitation and adjust your flight accordingly. Requires an internet connection to fetch the data.
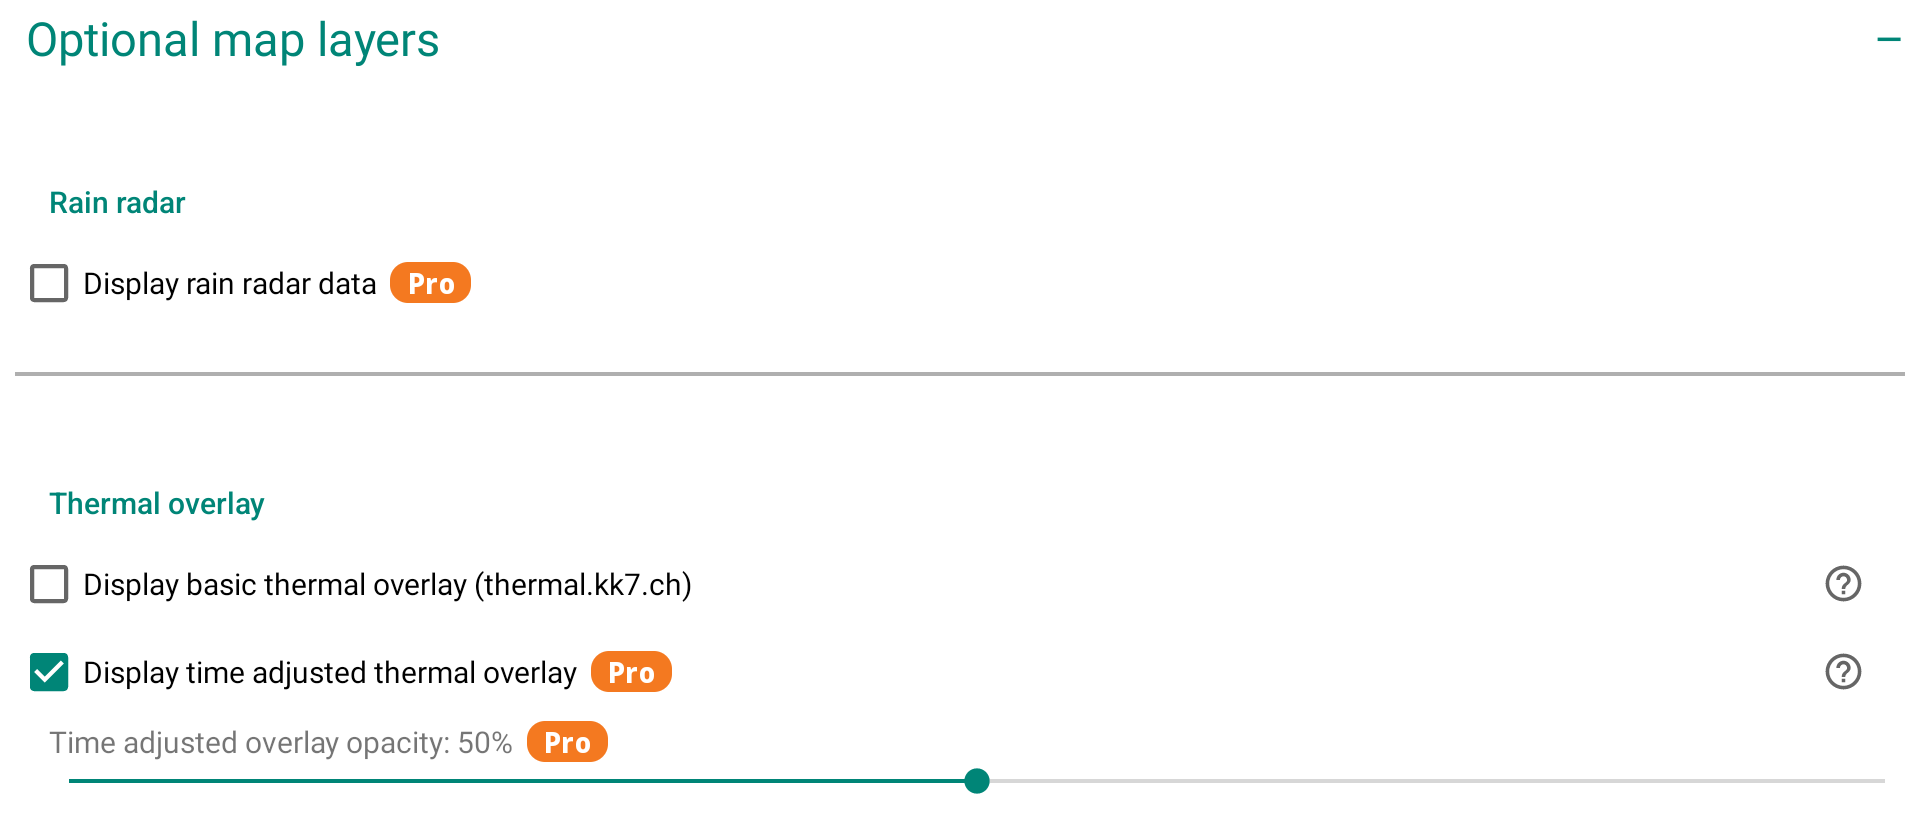
Thermal overlay
Thermal overlay (or also called thermal map) shows the probability to find a thermal uplift at a certain geographical location using a paraglider. The thermal maps are solely based on real flights and void of any model data. Data come from thermal.kk7.ch.
To be clear, the thermal map is a map of thermals calculated by analysing a large number of flights. It doesn’t correspond to the thermals associated with the current weather situation you have on any given day.
Once you have enabled the Thermal Map option, you will need an Internet connection to allow XCTrack to download the information for the area being displayed. Once downloaded, you won’t need an internet connection. However, if you move to a different location without an Internet connection, you won’t be able to get the information for the new area. In other words, you don’t need an in-flight connection to get the thermal map overlay if you’ve prepared your flight while connected, but it’s much easier if you have an in-flight connection.
All thermal maps correspond to a location on the ground where the thermal would originate from. Depending on your altitude, you need to determine thermal drift based on wind speed and direction.

“Display basic thermal overlay” provides information about possible thermal uplifts without any filtering (day of the year and the time of the day).
“Display time adjusted thermal overlay” provides information about possible thermal uplifts adjusted to cover current season and time of the day. For example, you can expect finding thermal uplifts in the morning from an east-facing slope and nothing on a west-facing one. However, as the data come from real flights, including flights which may have occurred on a west facing slope in the morning, thanks to a westerly wind…this will not always show up as previously mentioned.
You can easily observe these data in thermal.kk7.ch
If you select “Time filter”, you can see at a specific geographical location the change according to the day of the year and the time of the day.
By adjusting the opacity of both options, you can for example display the basic thermal overlay with a low opacity value that will always give you some info about the general situation, in the background…. and activate with a higher value of opacity the adjusted thermal overlay.
Thanks to the very bright color screen of AIR³, you can easily take advantage of this feature.
Example of a West-facing take-off site.
The AIR³ on top has been set to only Display time adjusted thermal overlay.
The AIR³ in the bottom has been set with a low opacity value to display the basic thermal overlay and a higher opacity value for the display of the time adjusted thermal overlay.

Example of a East-facing take-off site.
The AIR³ on top has been set to only Display time adjusted thermal overlay. As the flight is in the evening, there is no possible time adjusted thermal uplifts displayed.
The AIR³ in the bottom has been set with a low opacity value to display the basic thermal overlay and a higher opacity value for the display of the time adjusted thermal overlay. This allows to see the expected thermal uplifts with low opacity value.

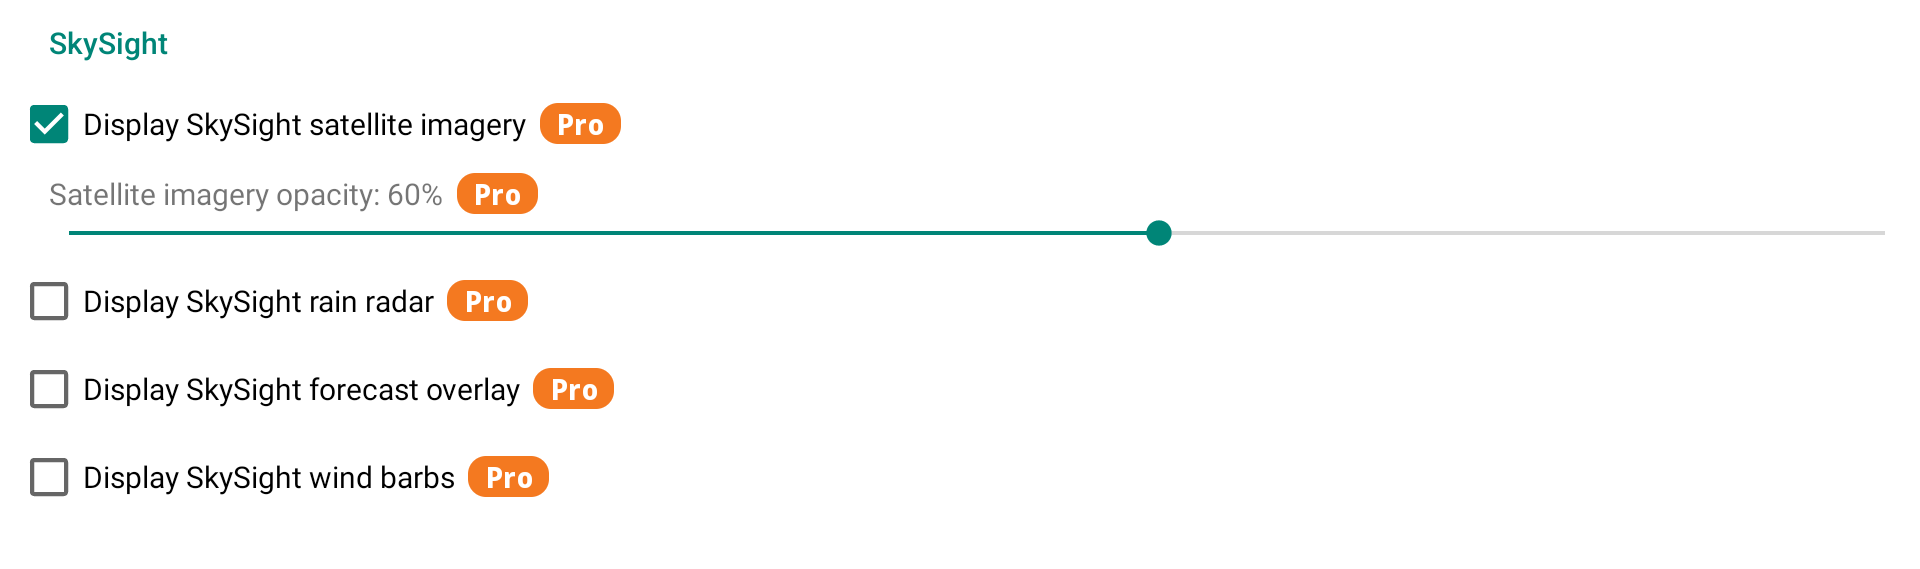
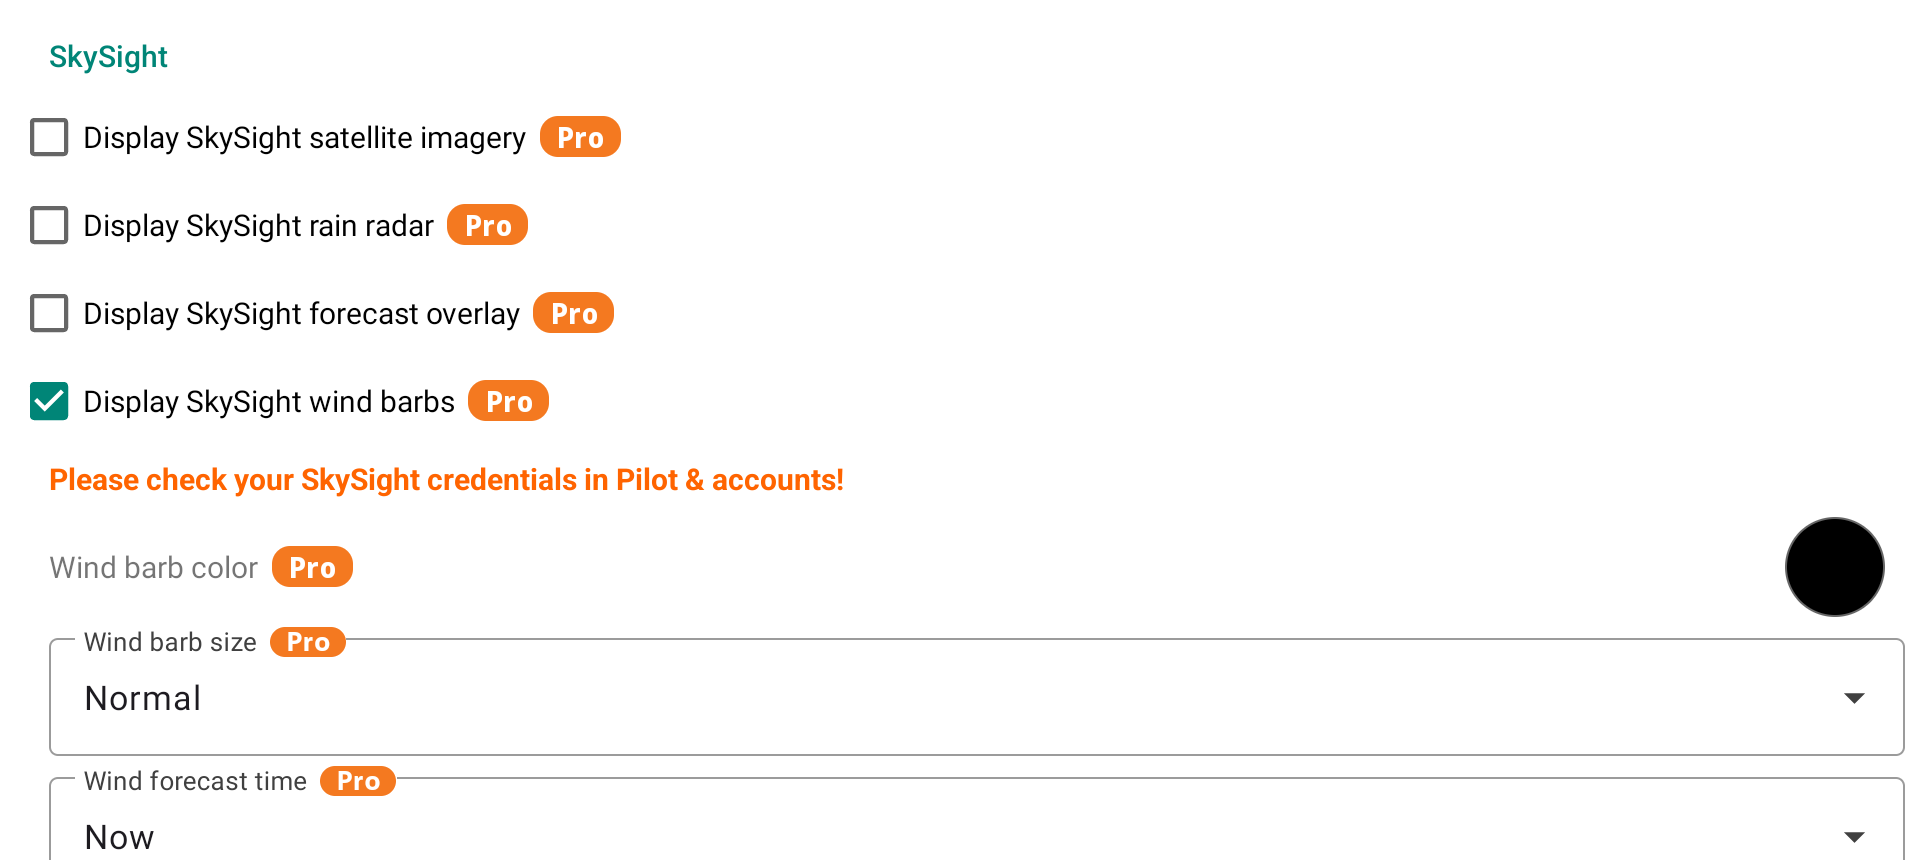
SkySight (Pro)
SkySight is a weather forecasting service tailored for free flight pilots. When enabled, SkySight data layers are overlaid directly on the map. A SkySight subscription and valid credentials (set in Menu/Pilot & accounts) are required.
Four layers are available:
- Satellite imagery — displays live satellite cloud imagery. An opacity slider lets you blend it with the underlying map.
- Rain radar — overlays live rain radar data on the map.
- Forecast overlay — displays a SkySight weather forecast layer on the map (Thermal Strength, Cu Cloudbase, XC Speed, Convergence, Thermal Wind, etc.). You can select which layer to display, adjust its opacity, and choose the forecast time — either Now or up to 4h ahead. Optionally, the forecast time can be shown on the map at a position of your choice.
- Wind barbs — shows forecast wind direction and speed across the map. You can customize the color, size (Small/Normal/Large), and forecast time and position (Now or a future time slot).
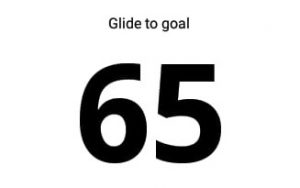
Optimized distance through the remaining turnpoints to goal

Optimized distance through the remaining turnpoints to ESS.

Arriving altitude over goal line/cylinder.
Based on your current altitude (GPS altitude) and the glide ratio that is indicated in the Menu/Preferences/Aircraft/Glide ratio, this widget will display the altitude over goal once you are approaching the goal (once the altitude over goal is above 1000m below the goal).
It is taking into account the route to the goal passing through the optimized route of remaining waypoints.
The value is computed from the necessary time to glide through the route, based on Menu/Preferences/Aircraft/Glide ratio. The time is computed from Menu/Preferences/Aircraft/Trim speed and current wind (and the route of course). If there is any turnpoint to still reach before the goal, there is a constant of 15 m of altitude loss at every turnpoint.

Altitude over goal: -140m if you still need to pass through a waypoint…

but Altitude over goal: +321m if you directly go to the goal…

Arriving altitude over ESS.
Based on your current altitude (GPS altitude) and the glide ratio that is indicated in the Menu/Preferences/Aircraft/Glide ratio, this widget will display the altitude over ESS once you are approaching the ESSl (once the altitude over ESS is above 1000m below the ESS).
It is taking into account the route to the ESS passing through the optimized route of remaining waypoints.
The value is computed from the necessary time to glide through the route, based on Menu/Preferences/Aircraft/Glide ratio. The time is computed from Menu/Preferences/Aircraft/Trim speed and current wind (and the route of course). If there is any turnpoint to still reach before the ESS, there is a constant of 15 m of altitude loss at every turnpoint.

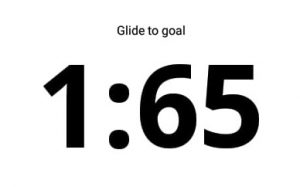
Glide ratio necessary to reach goal.
You can decide if you want to display it with or without leading 1:

Glide ratio necessary to reach ESS.
You can decide if you want to display it with or without leading 1:

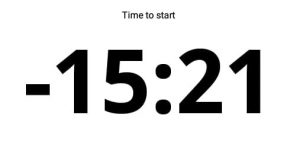
Time to next start gate.
This widget simply tells you the remaining time to next start gate.
Example:

Time you cross the SSS.
The value is computed either based on the route to the [Optimized point] … or based on the nearest point (cylinder).
You can Activate “Use distinguishing brackets” in order to quickly identify your previous settings: [Optimized point] (Cylinder)
Reminder:
- “Optimized point” takes into account the route to the optimized point. This is the most used setting
- “Cylinder (nearest point) takes into account the route to the nearest point of the start circle.


Speed used for computation. You can choose between Groundspeed, Airspeed with wind compensation, Glide speed with wind compensation, XC speed.
Groundspeed: your actual speed over ground is used. If you fly toward the point, you will see how much time it takes (the wind is included implicitly), but if you are circling, the value will change all the time because of the different ground speed upwind and downwind.
Airspeed: see Airspeed widget info in the Flying section. Airspeed is computed based on groundspeed and computed wind. It is the speed that would have been indicated if the pilot had a airspeed sensor (tube). It actually depends on your braking/accelerating position. The value computed is the time when you reach the point in the current breaking/accelerating settings. If you fly directly (but you don’t need to do it), this is the difference between ground speed and airspeed.
Glidespeed: the speed from glider configuration corrected by wind. It doesn’t matter how fast you are flying right now nor direction. It indicates when you reach the point if you fly directly and on configured airspeed (for example full accelerated flight speed).
XC speed: Time calculated on the speed based from the biggest xc distance (distance over 3 breaking point) and the flying time. Can be used for large FAI triangle hunting.
Based on the setting, speed can vary very much. The “averaging interval” gives the opportunity to compute based on average interval.
Finally, you can decide which format you want to display the Time at start…


Speed to go to reach the start cylinder at the right time.
The value is computed either based on the route to the [Optimized point] … or based on the nearest point (cylinder).
You can Activate “Use distinguishing brackets” in order to quickly identify your previous settings: [Optimized point] (Cylinder)
Reminder:
- “Optimized point” takes into account the route to the optimized point. This is the most used setting
- “Cylinder (nearest point) takes into account the route to the nearest point of the start circle

Show percentage of flown task distance, from Start to ESS (to help with leading points)

Task information reminder

Next section: