This page gives details on the widgets that are in the “Competition” subsection. They can be accessed by customizing the XCTrack Pro pages pre-installed on AIR³. Remember that your customisations will be lost if you reset XCTrack Pro interface with AIR³ Manager, if you change the profile (Kiss, Easy, Expert, Paramotor) or if you load a different configuration file ‘xcfg’.
Read more details about competition in Menu/Navigation/Competition of the main XCTrack Manual.
A video tuto for competition has also been produced. Watch it in the video’s page.
Click on the + sign to read the details.
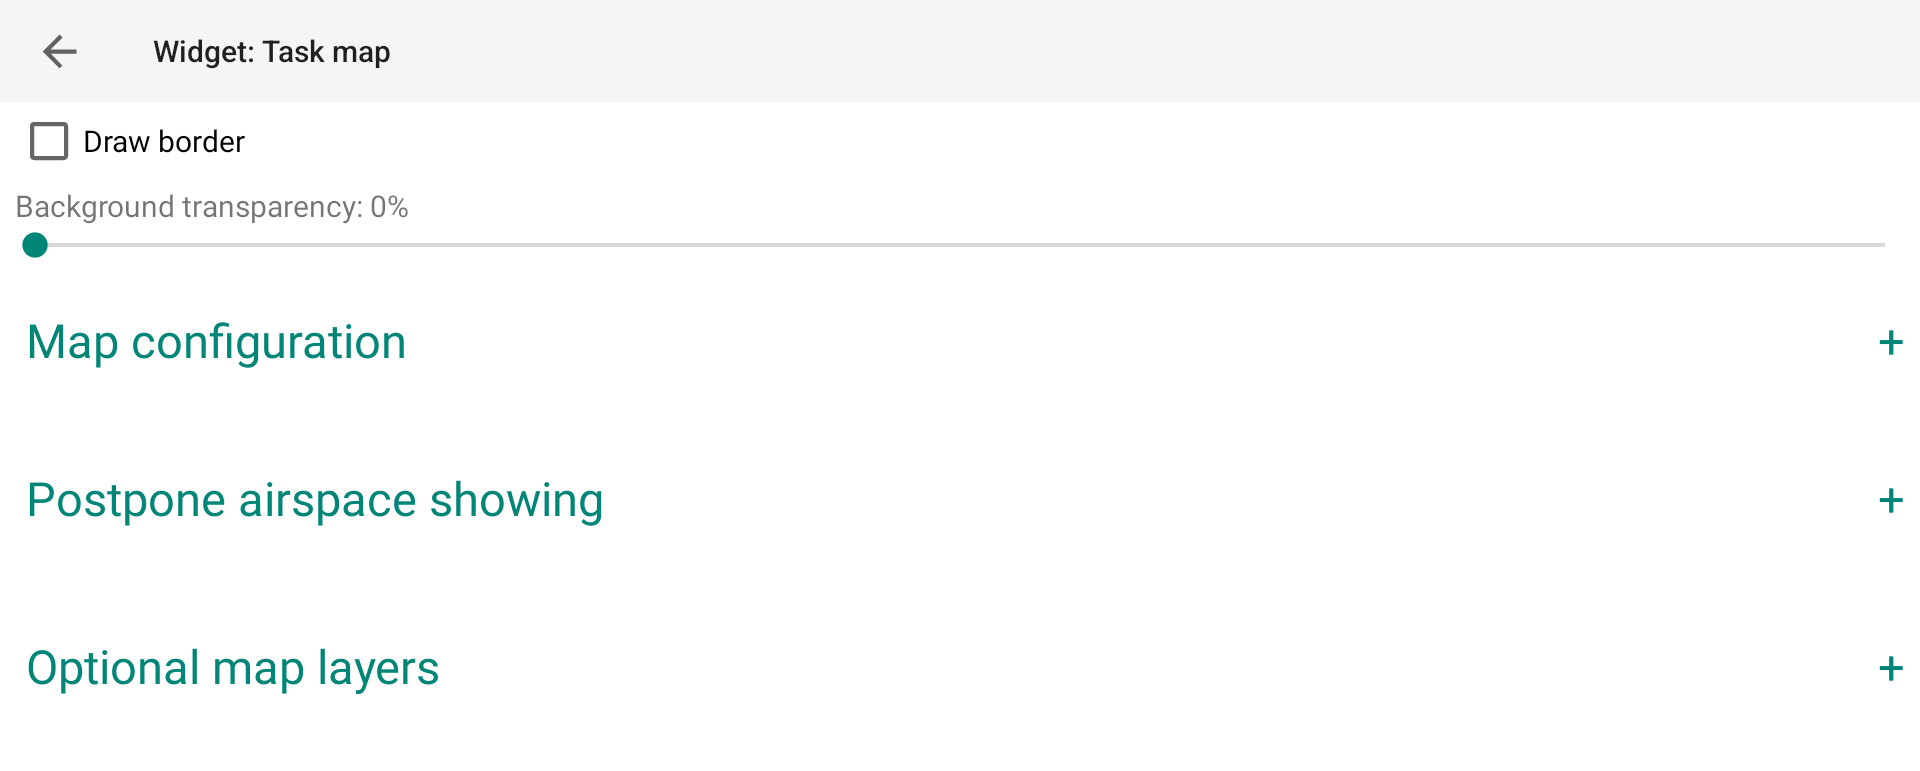
The Task map widget is divided into 3 main sections: Map configuration, Postpone airspace showing and Optional map layers.
Click on the "+" sign to unfold the section.
Click back on the "-" sign to fold it back.
You can choose a style for the map widget that differs from the main theme.
This can be quite convenient for the map widget, so that you can get the benefit from the Black theme to reduce energy consumption for the main widgets and still use a White style for the map widget so that you can easily read information on the map. Not all pilots are used to read maps with a white on black map.
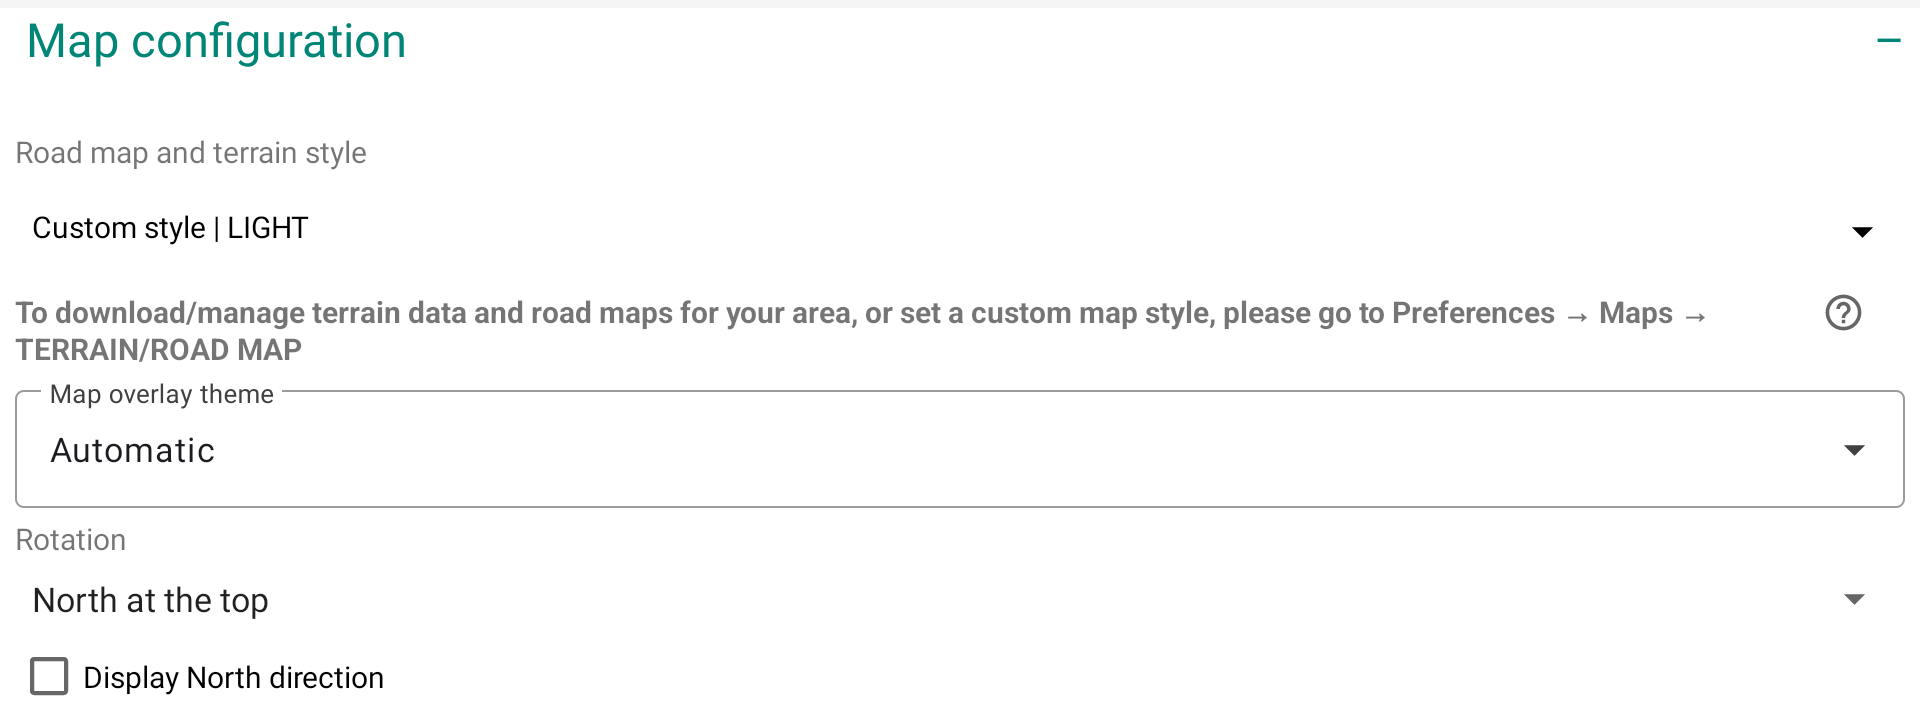
In the Map configuration section, you can
- decide the road map and terrain style to use
- decide which map overlay theme you want to use
- decide the way you want the maps to be displayed according to what should be at top (read more in the next section below)
- display a small compass on the map to display north direction
Road map and Terrain Style
A “style” is the combination of a Roadmap Theme Type and a Terrain Type.

Terrain type
Terrain type is the way Terrain is rendered. 3 types: LIGHT, DARK or XCONTEST.
Here below, the map widget is set with no Roadmap, only Terrain with the three Terrain types.
LIGHT
DARK
XCONTEST
Roadmap Theme Type
Roadmap Theme Type is the way Roadmap is rendered. Let’s consider two categories: classic and transparent.
Classic Roadmap Theme Types are legacy types such as Lightpilot, Hyperpilot, VTM, Newtron, etc. Some of them can be displayed with mainly white or mainly black rendering. Rendering a Classic Roadmap Theme Type with the Terrain Type is more like hillshading, while rendering a Transparent Roadmap Theme Type with the Terrain Type is much more powerful to clearly see the relief.


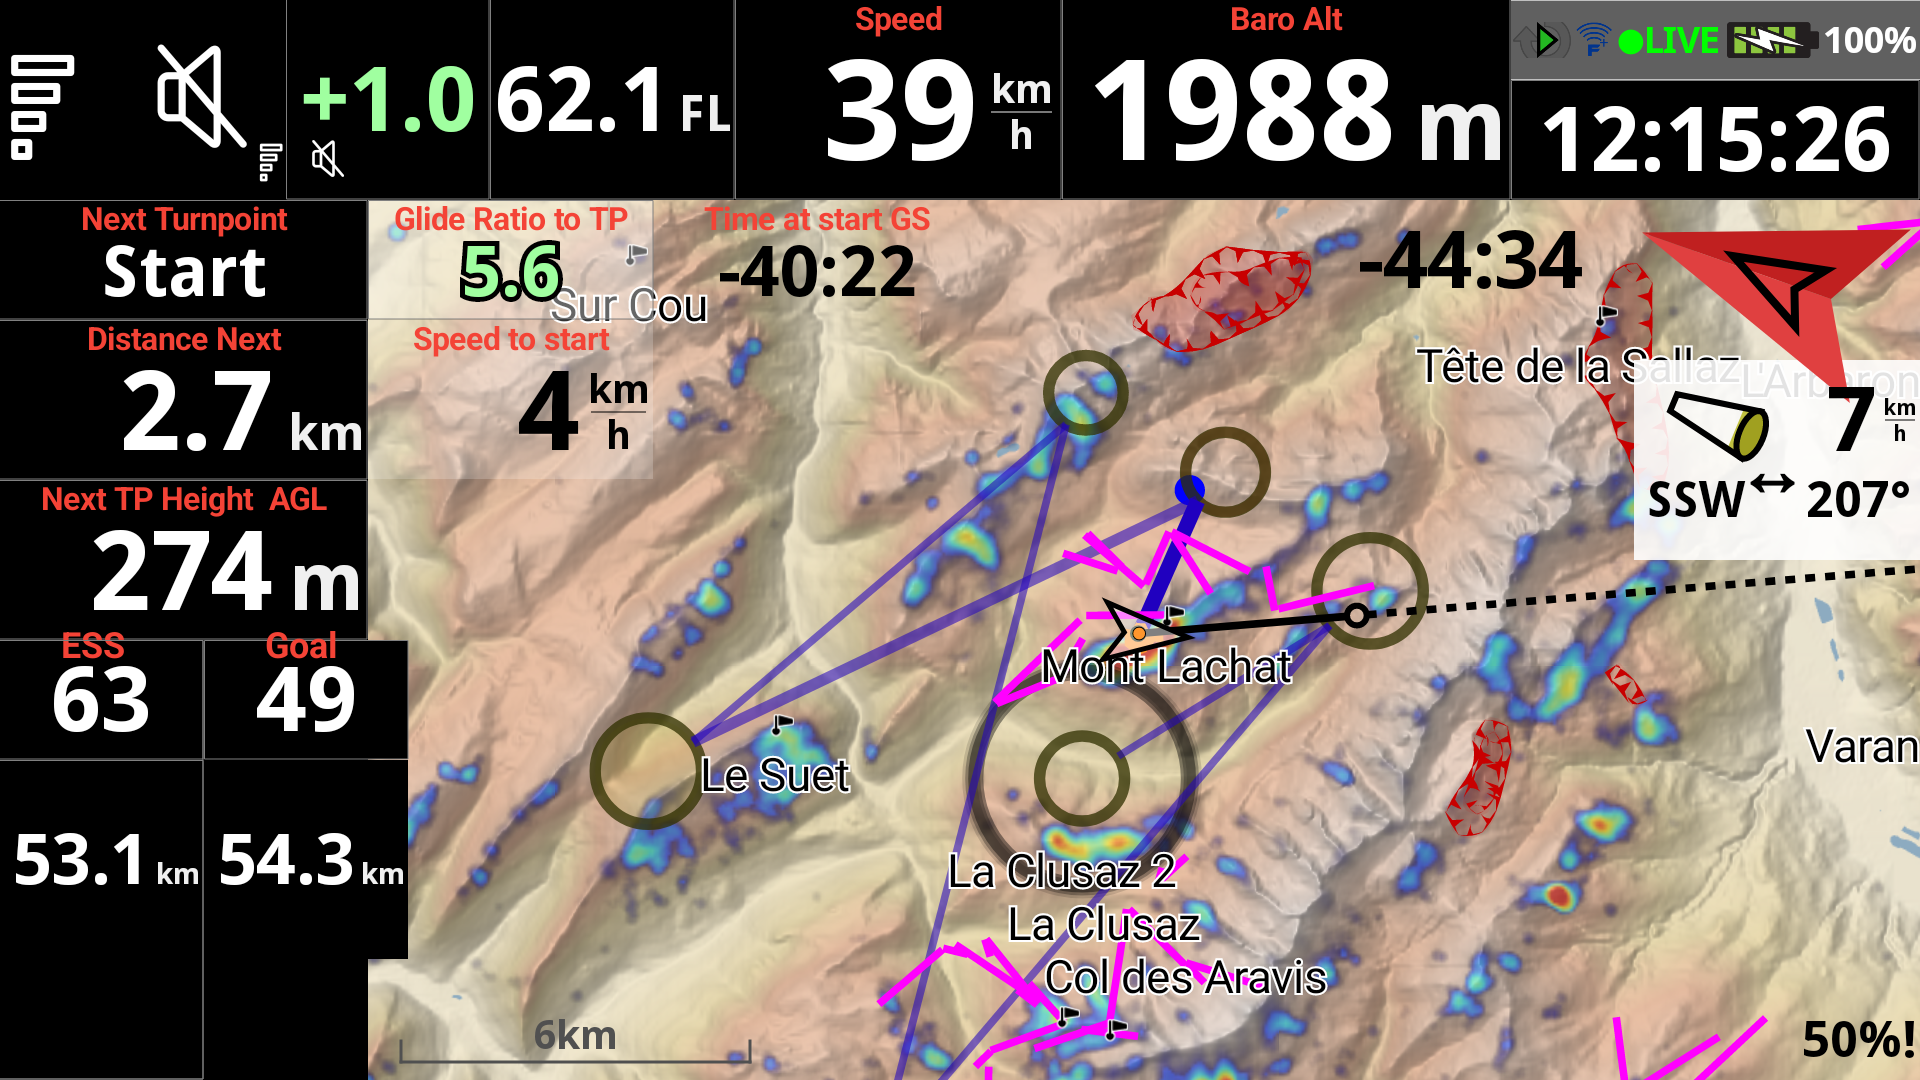
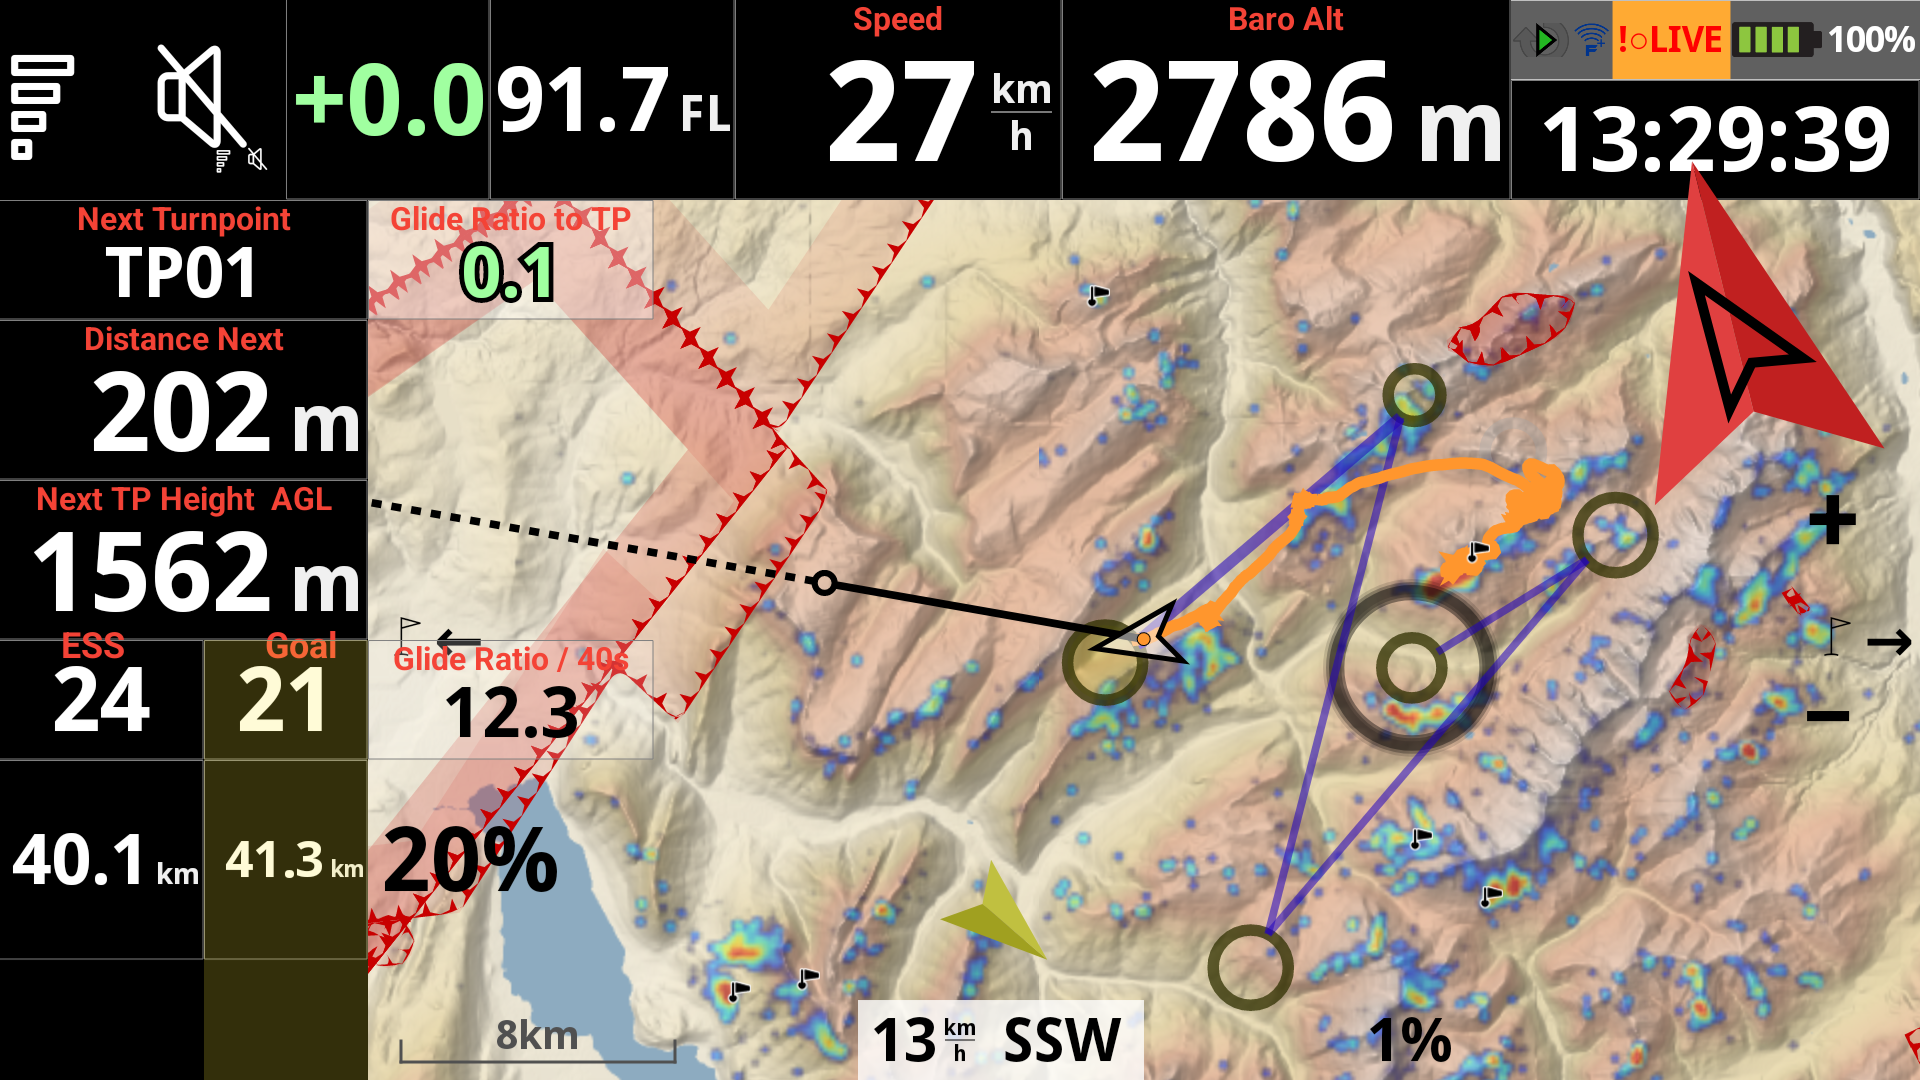
Transparent Roadmap Theme Type is based on Clearpilot. You can choose between different variants, ligther or darker, with forests or not, with bigger fonts… Together with the Terrain Type, you can choose you favorite rendering.


Here is the rendering of the map widget with Clearpilot (forests) and XCONTEST style.
Custom Map Type
You can choose one of the available Road map and Terrain Styles, or use a Custom Roadmap Theme Type based on a custom XML file that you can select in Preferences/Maps/Roadmap.
AIR³ proposes a special Custom version based on Clearpilot called Clearpilot-AIR3-BIG-CITIES. If you want to take advantage of it with your AIR³, get the latest version of AIR³ Manager (> 3.0) and the latest version of XCTrack (>0.9.12). Reset the XCTrack interface as explained here and you will benefit from this special version.
Note that the rendering may vary significantly depending on the zoom level.


Map overlay theme
The Map Overlay Theme is what used to be called “widget theme”. It refers to how XCTrack will draw objects like FAI sectors, cylinders etc.
Automatic will use the appropriate mode depending on the main display theme and the map style. For example: with Black High Contrast as system theme and a dark map, the Map overlay theme will be black high contrast. If the map is not dark, it will use white high contrast for overlay.

Black
White
White high contrast
eInk
In the Map configuration section, you can also:
- scale the map to fit the next turnpoint or define a fixed map scale
- reset the map scale to default after exiting panning mode
- keep the pilot at a given distance from the edge of the screen
- display the map scale in the bottom left of the map
- show your relative position in panning mode
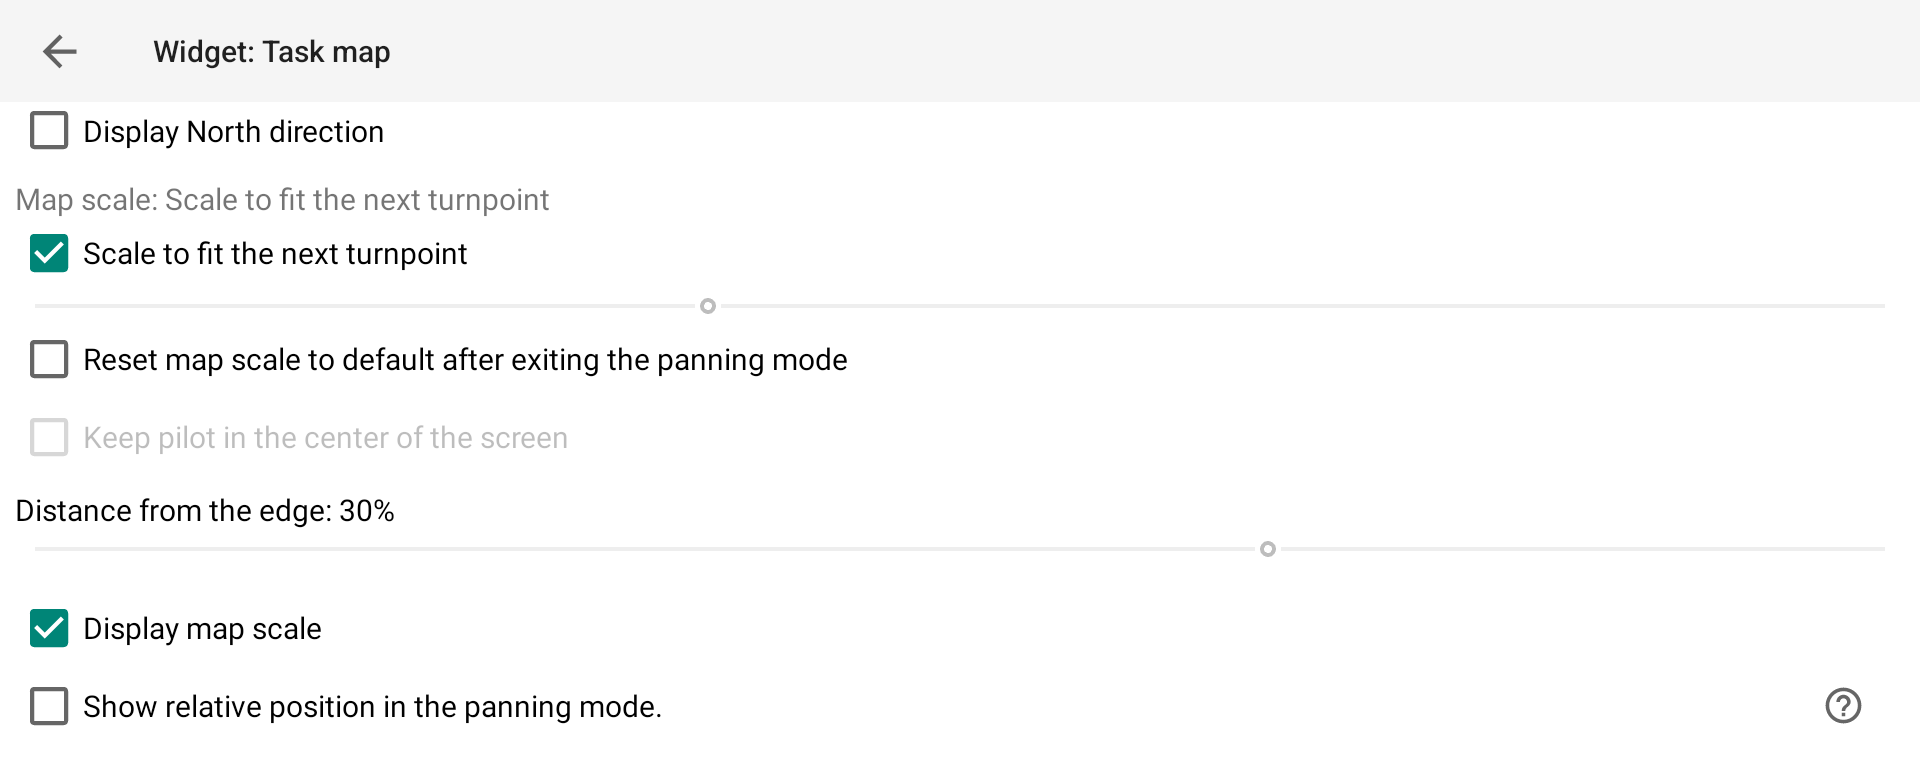
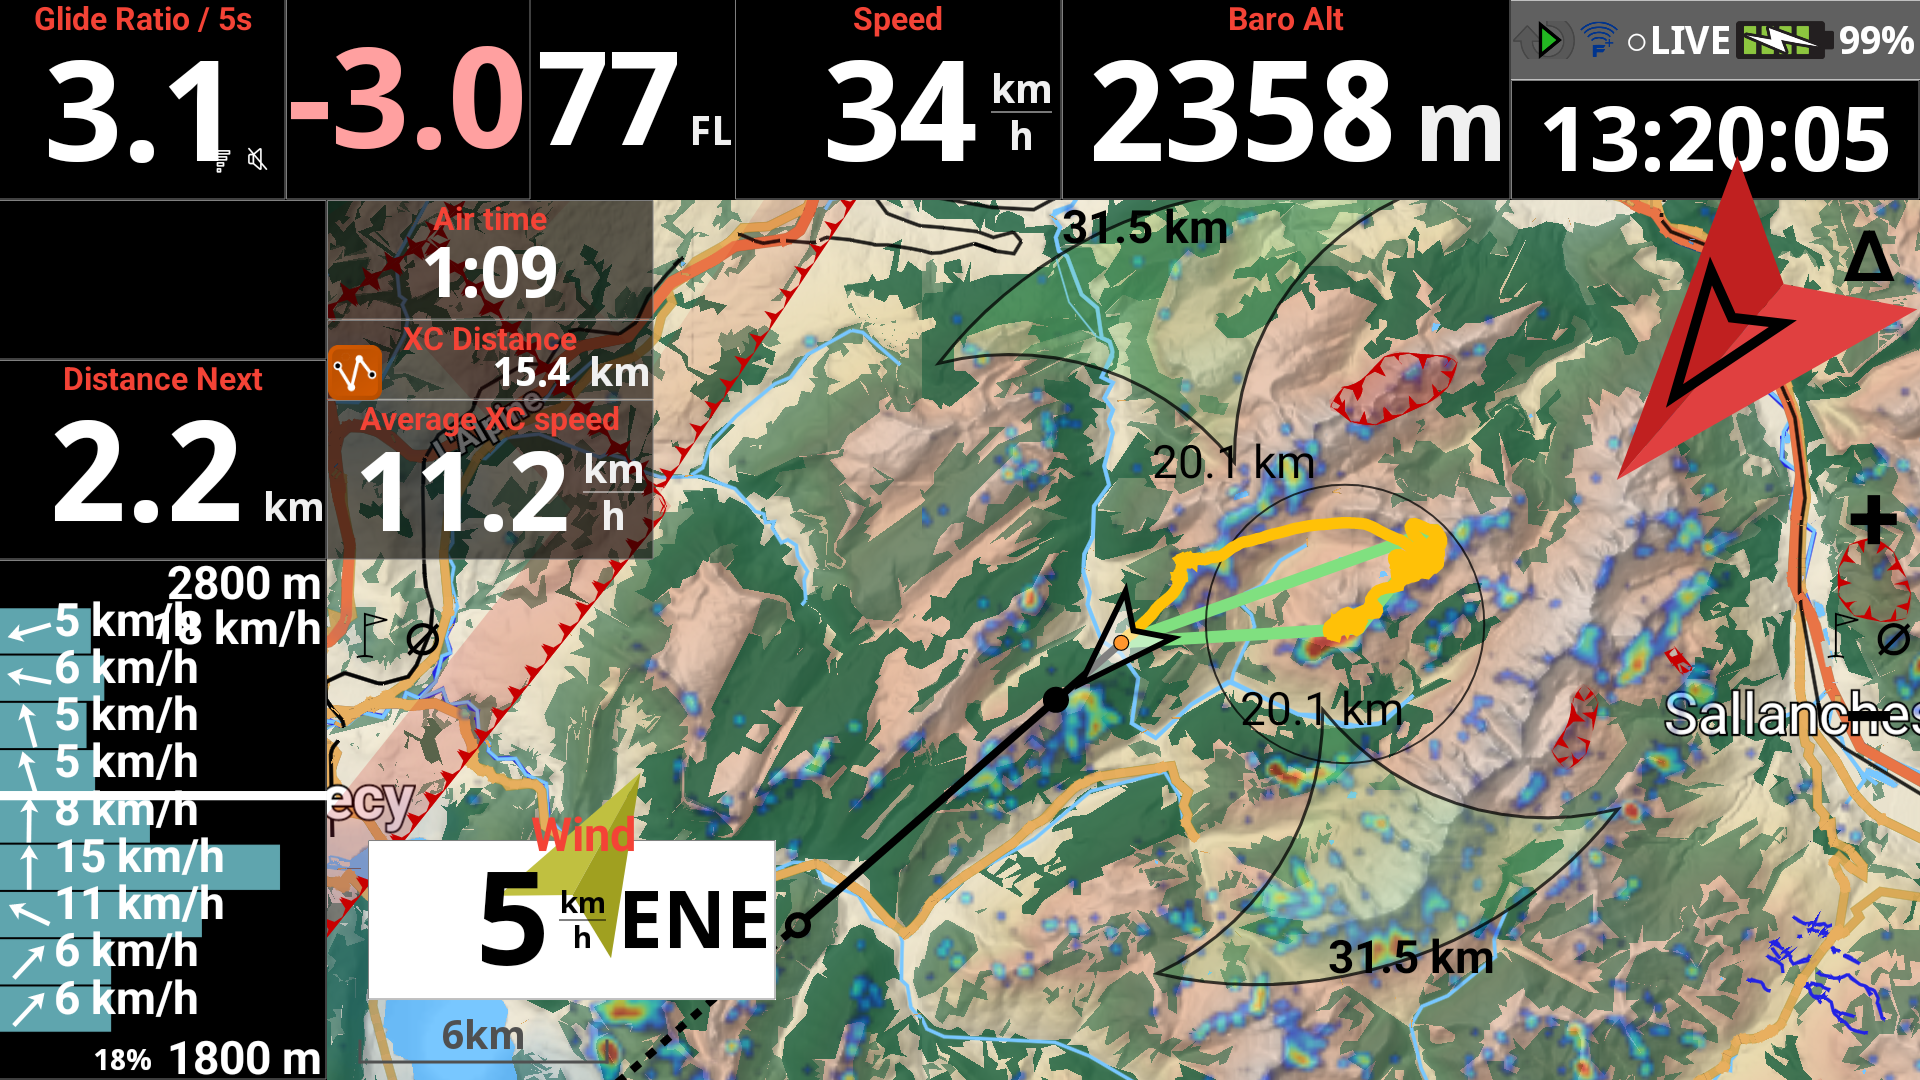
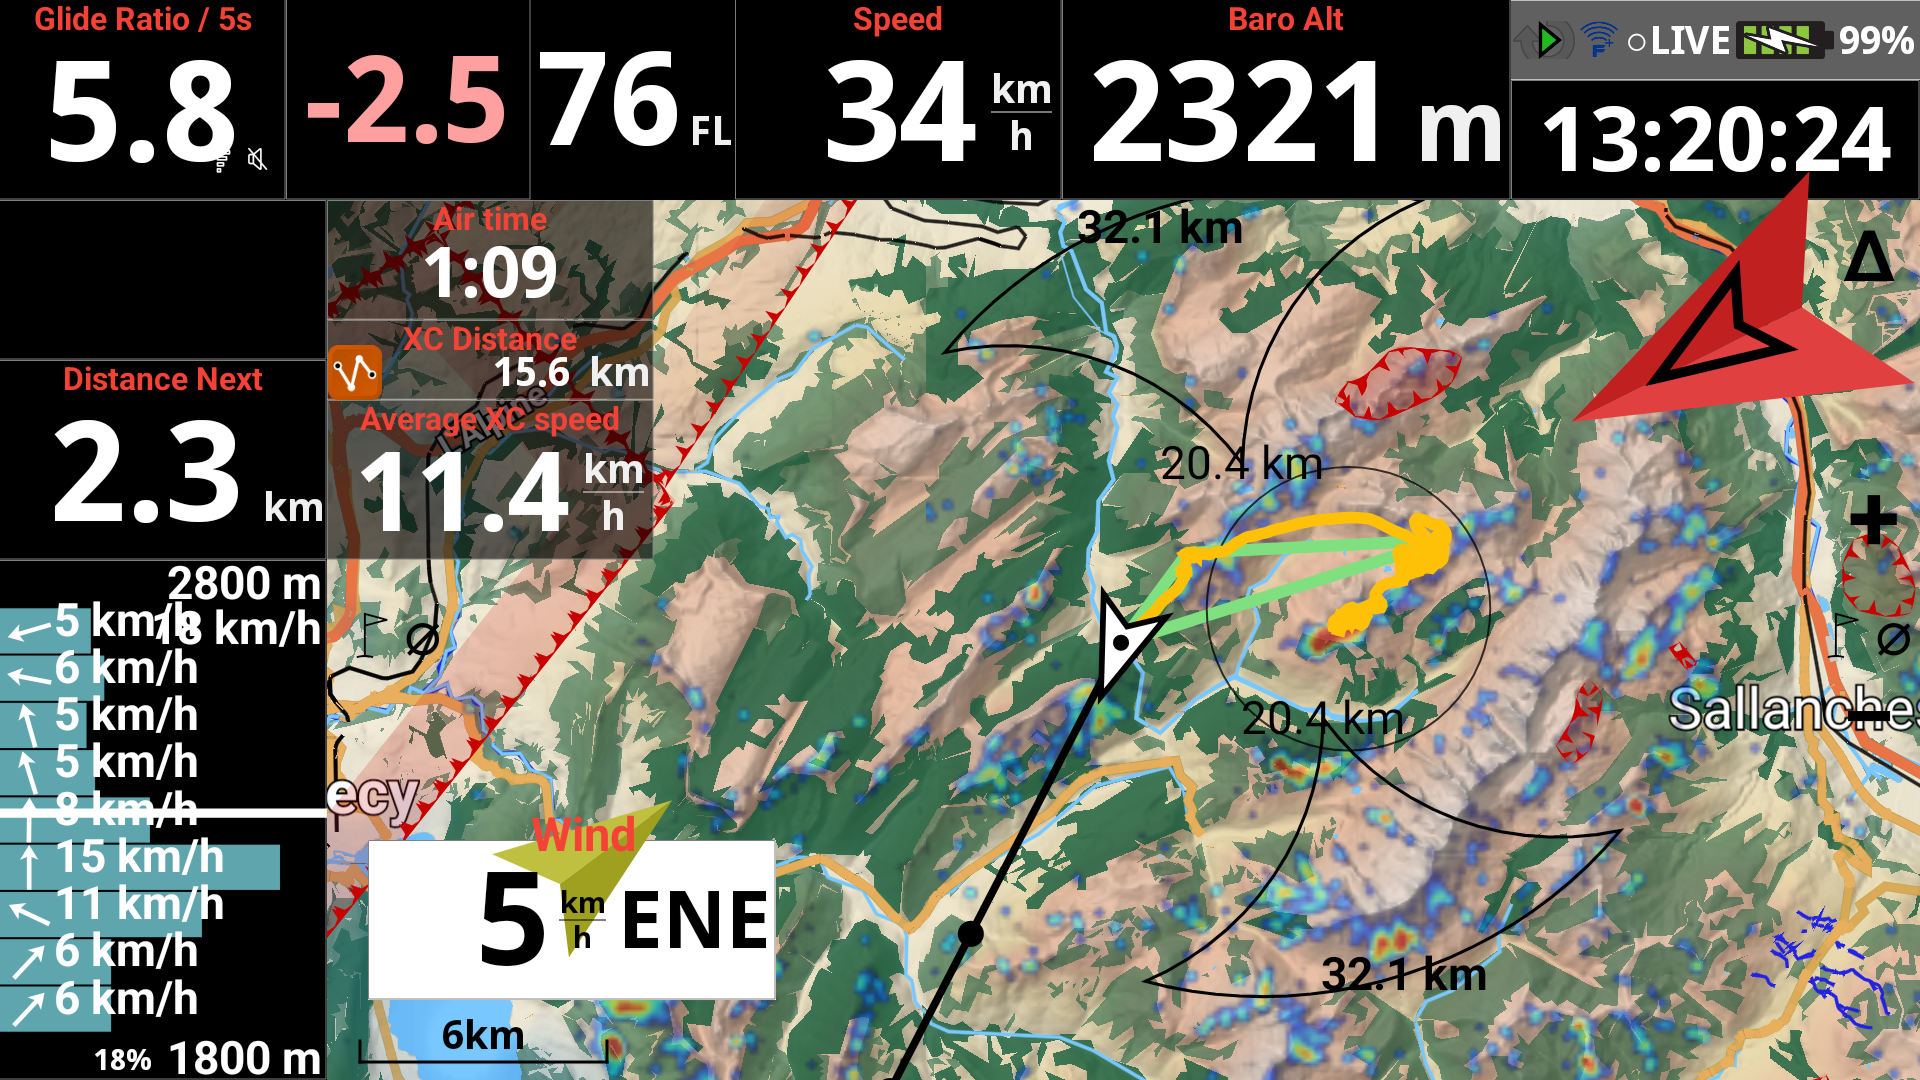
Scale to fit the next turnpoint
When enabled, the map automatically adjusts its zoom level to keep both the pilot and the next turnpoint visible on screen at all times. If disabled, you can set a fixed map scale using the slider.
Reset map scale to default after exiting panning mode
When enabled, the map zoom returns to its normal scale after exiting panning mode, even if you had manually zoomed in or out while panning.
Distance from the edge
Defines how far from the edge of the screen the pilot position is displayed. Useful to leave more map visible ahead in the direction of flight.
Display map scale
Shows the current map scale in the bottom left corner of the map.
Show relative position in pan mode
Allows you to know your position relative to the center of the map while panning the map ( see here how to enter pan mode).
Useful when you need to know your relative position to a place (airport i.e.).
You can change the unit in Menu/Preferences/Display/Units.

In the Map configuration section, you can also:
- define the map language
- display or not airspaces and obstacles
- show an alert screen when approaching an obstacle
- enable automatic zoom in emergency obstacle mode
- define the duration after which panning mode exits automatically
- set how airspaces are displayed in panning mode
- define how long an airspace is highlighted when switching between airspaces in panning mode
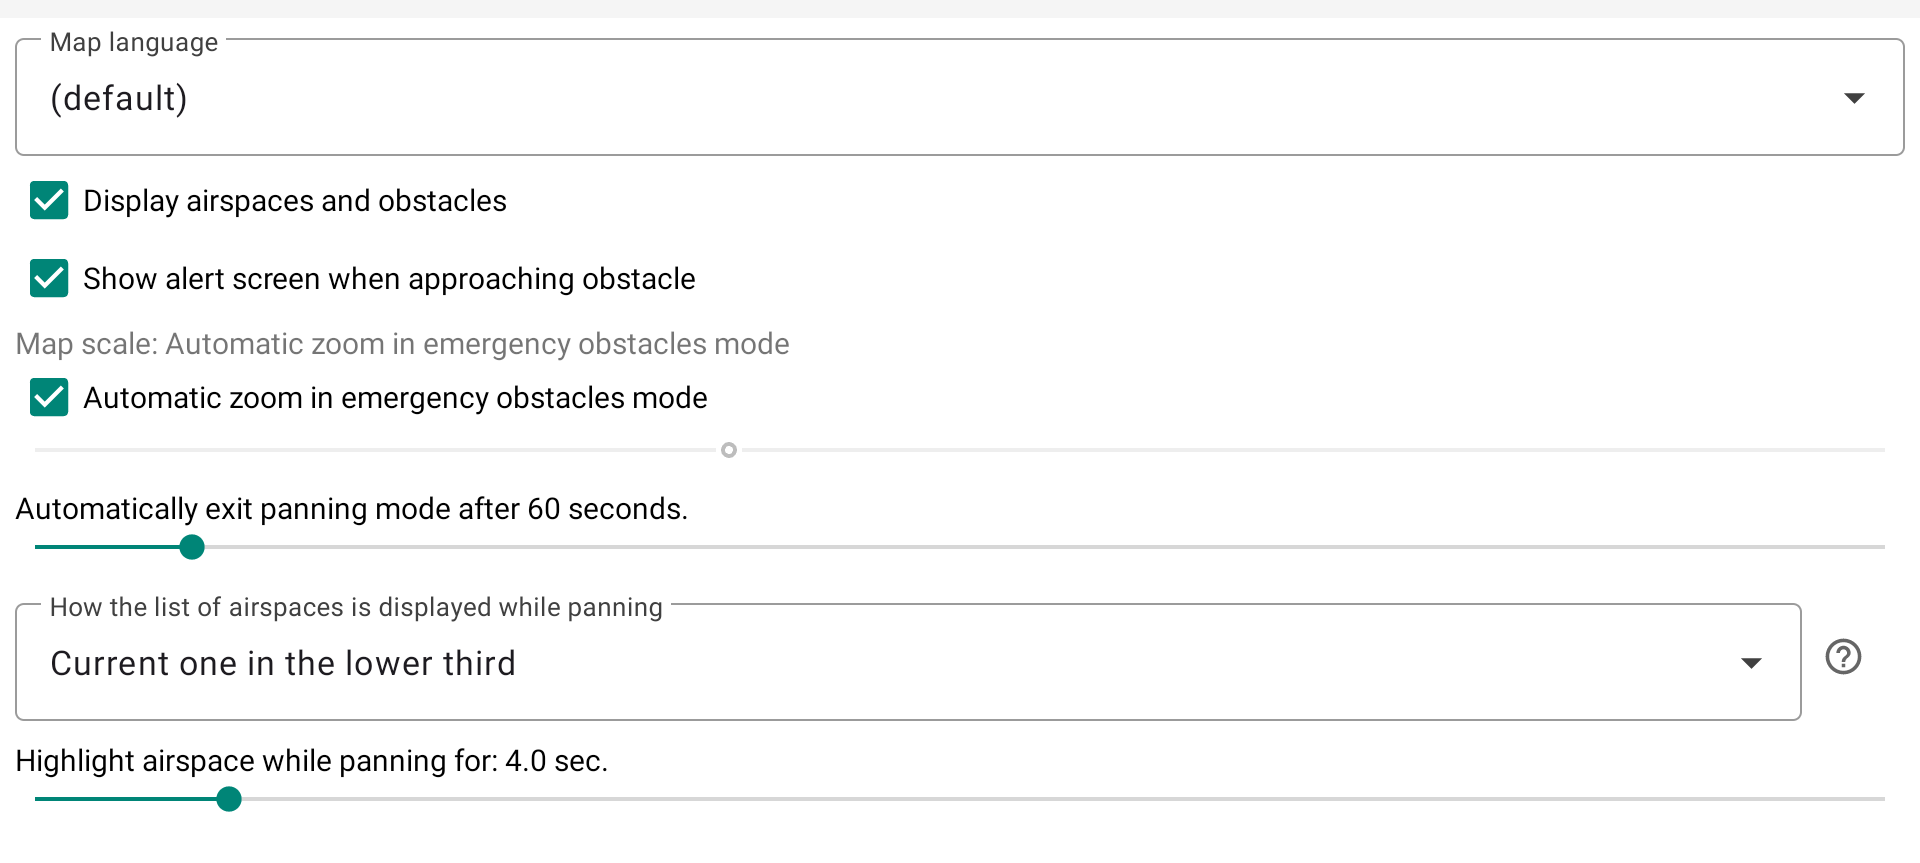
Map language
You can define the language of your map that can differ from XCTrack default language. Note that this will be valid only if your Roadmap file supports the language you select. Check on Openandromap website whic languages are supported in your region.
Display Airspaces and Obstacles
Airspaces map can be shown by enabling the “Display airspaces” option.
Read more details about how to set up airspaces in Menu/Preferences/Airspace.
If you activate other maps such as Terrain and RoadMap, Airspaces will always be on top.
If you want to know more about Airspaces and how to get airspaces information with AIR³, watch the tuto video related to Airspaces in the videos page.

Obstacles will only be displayed if
- You have downloaded and activated the Obstacles database in Menu/Preferences/Airspaces/Obstacles
- You have activated the option “Show only” or “Show and alert” for the Obstacle category you intend to see on the map in Menu/Preferences/Airspaces/Settings
- You have activated the option “Display Airspaces and Obstacles”
Show alert screen when approaching an obstacle
The enabled option will change a map into a special ‘zoomed in’ mode when you get near an obstacle, so that you could see clearly where you are and where is the obstacle.
You can either decide to use the “Automatic zoom in emergency obstacle mode” or select the map scale you want to apply in case of alert when approaching obstacle.
This feature requires to have activated the obstacle alert mechanism in the Menu/Preferences/Airspaces/settings.
This special map conversion alert linked to the Obstacle alerting system will only work if
- You have downloaded and activated the Obstacles database in Menu/Preferences/Airspaces/Obstacles
- You have activated the option “Alert only” or “Show and alert” for the Obstacle category you intend to be alerted from, in Menu/Preferences/Airspaces/Settings

By deactivating this option, the Obstacle alerting mechanism will not change the map into this special ‘zoomed in’ mode when approaching an obstacle, but the alert will be displayed on top.

Automatically exit panning mode after N seconds
Panning mode lets you freely explore the map by dragging it away from your current position — useful to check terrain, airspaces, or plan your route ahead. To enter pan mode, swipe up on the map widget. To exit, tap the cross button on the right, press the Android Back button, or the physical Back button on AIR³.
Since you are still flying while panning, this slider sets how many seconds before XCTrack automatically returns to normal tracking mode and re-centers on your position.
How the list of airspaces is displayed while panning
When you pan the map, XCTrack can display the airspaces at the centered cross location. Three display modes are available:
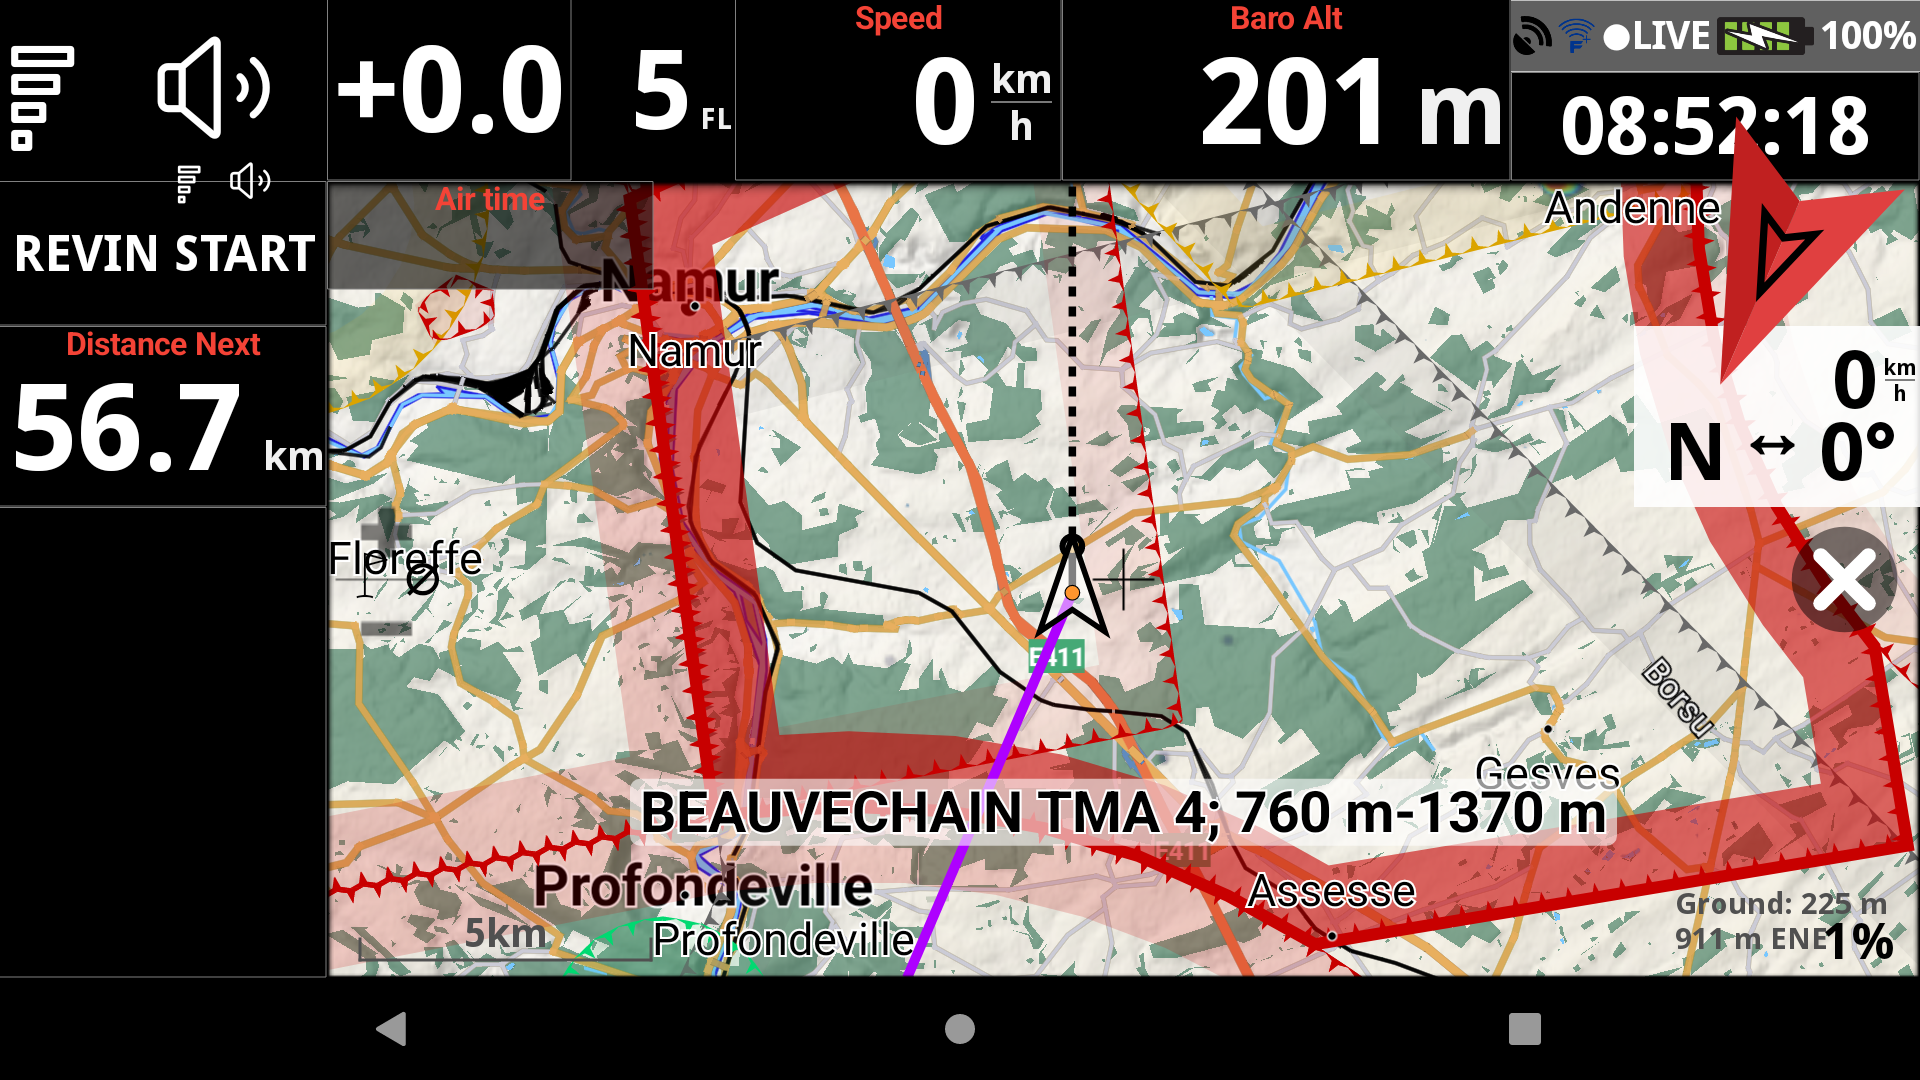
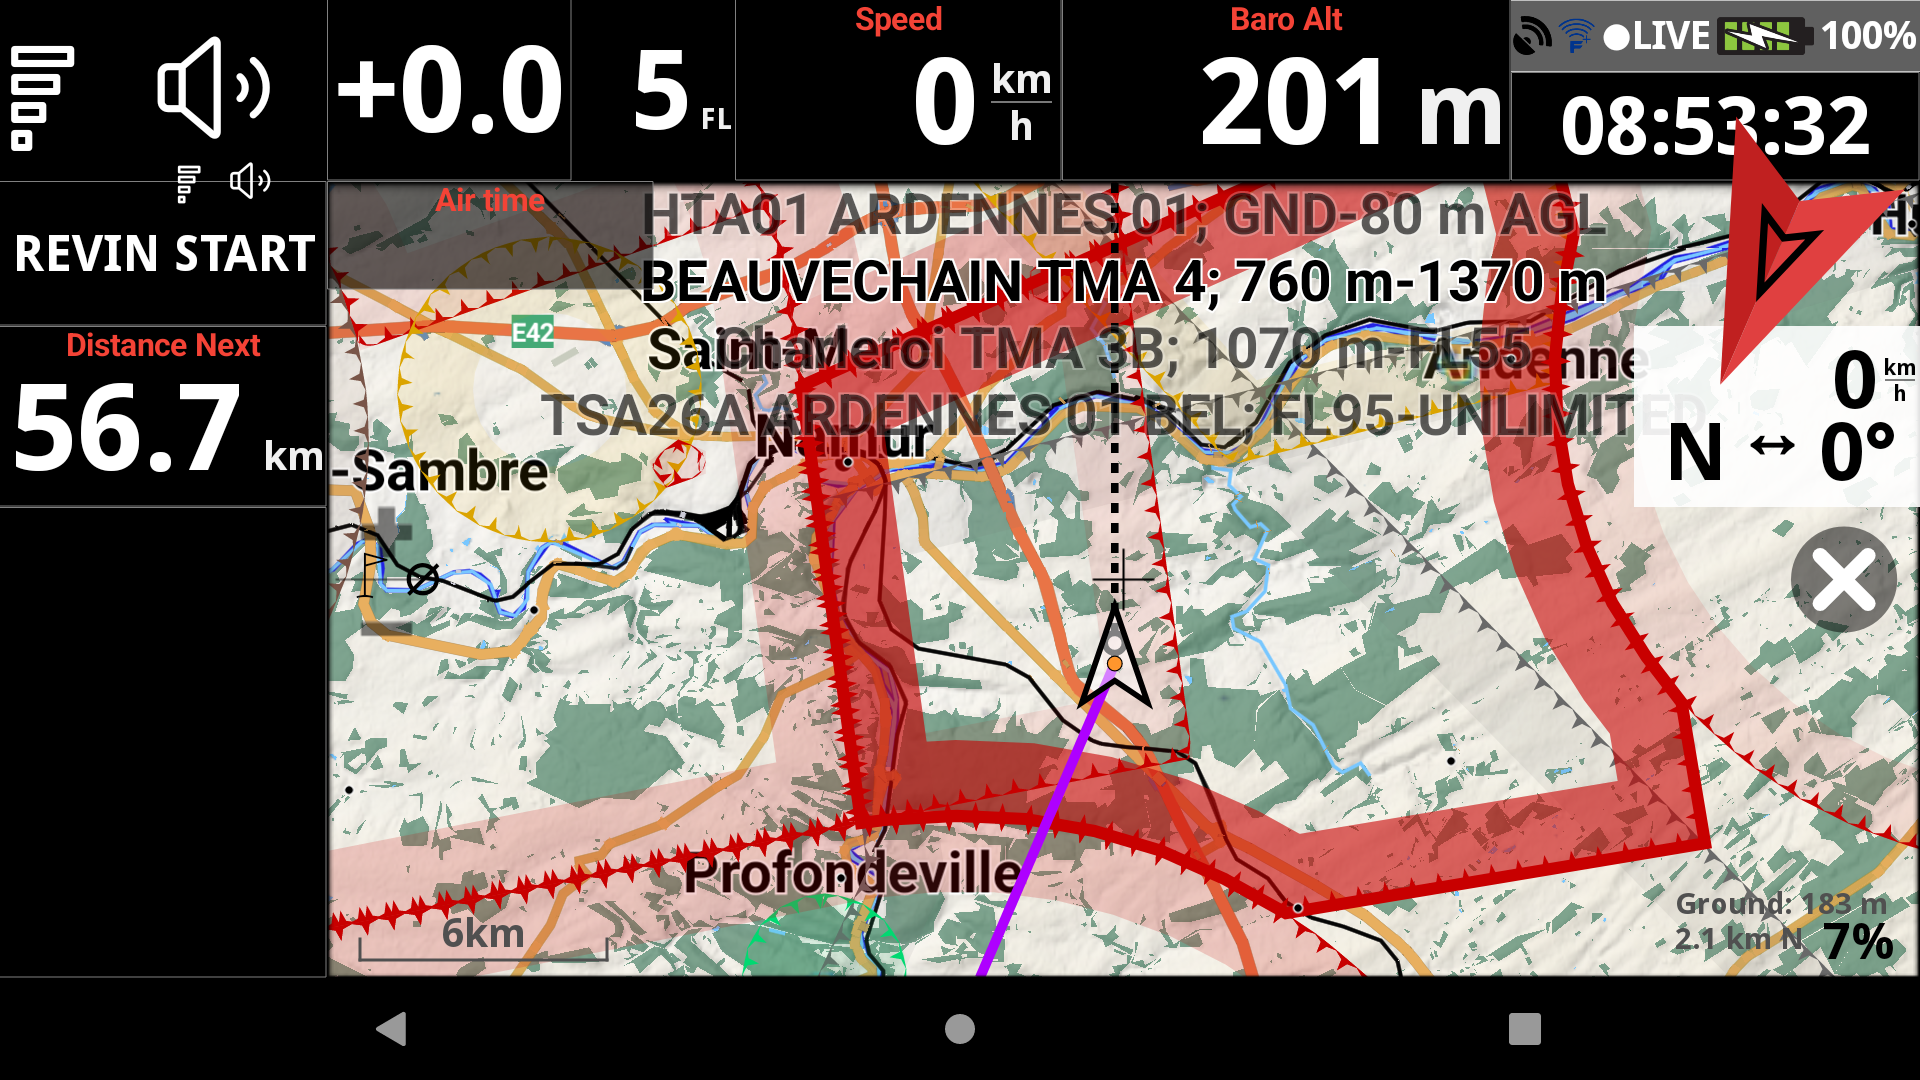
- Current one in the lower third — only the currently highlighted airspace is shown in a banner at the bottom of the map. Clean and readable at a glance.
- Complete list on the top — all airspaces at the panned location are listed across the top of the map. Useful to get a full picture of the airspace stack.
- Both — combines the two displays simultaneously.
Highlight airspace while panning for: N sec.
When you pan over a location with multiple airspaces, you can cycle through them. This slider defines how long each airspace stays highlighted before moving to the next one. Adjust it to your preference — a shorter duration cycles faster, a longer one gives you more time to read the details.
Display nearby pilots
Display nearby pilots on the map (you need to have activated the livetracking). Read more details about Livetracking in Menu/Preferences/Livetracking and Menu/Livetracking.
Display the tracklogs of selected pilots
To select pilots, go to Menu/Livetracking. In the Flights tab, you will see the list of pilots that are currently flying. You can select the pilots you want to display.
For more details regarding livetracking, watch the XCTrack Pro for AIR³ tutorial in the videos’s page
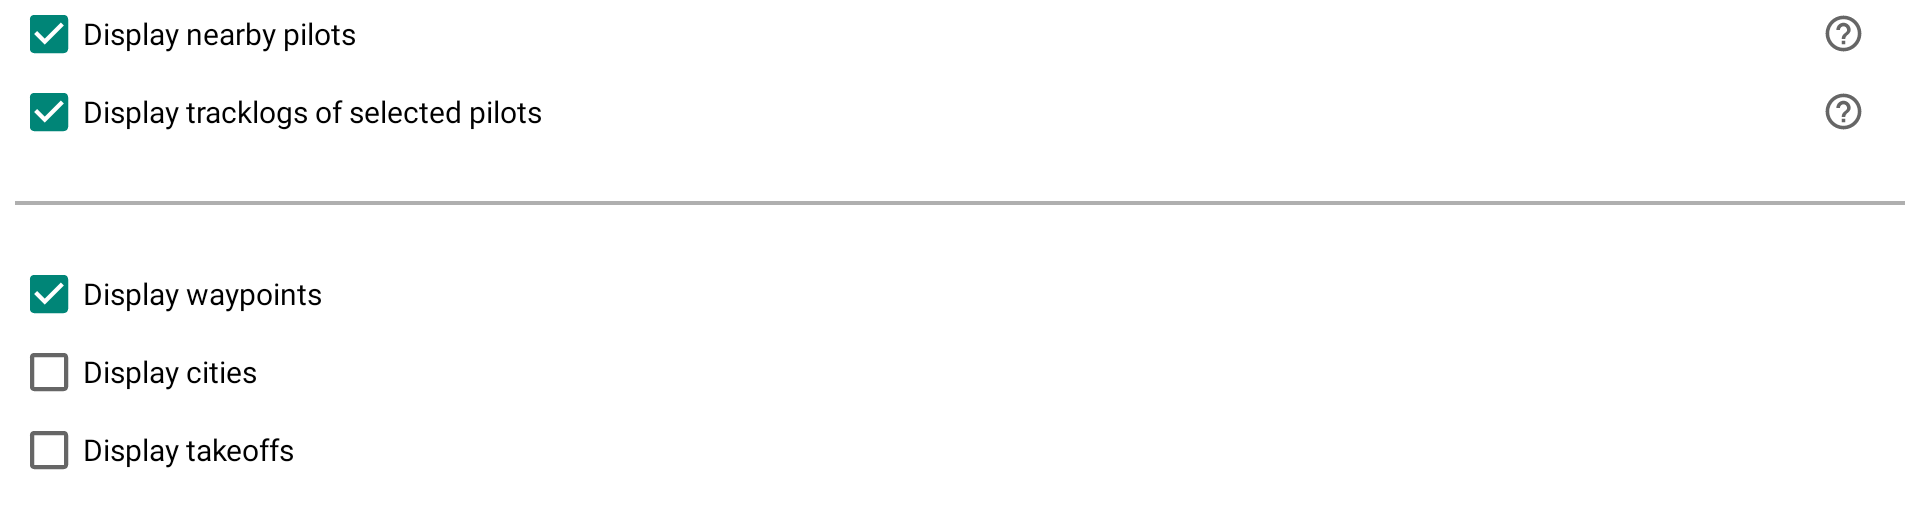
Display waypoints
Don’t forget to activate the waypoint file that contains the waypoints you want to display. Read more details about how to activate a waypoint file in the Navigation menu.
Go to Menu/Navigation and click on the Waypoints in the upper right to access the waypoint menu. In the Files tab, you can see the wpt files that are located in the Waypoints folder of XCTrack. The size of the waypoint name on the map is set in the font size portion below.
Display cities
Large cities of each country have been integrated into XCTrack. This option is useful if you have not activated the RoadMap display. With RoadMap display enabled, you will have the name of the large cities display twice: with the RoadMap and with the display cities option. The size of the name of the large cities on the map is set in the font size portion below.
All AIR³s are provided with waypoint files containing cities with a population of 5,000 or more.
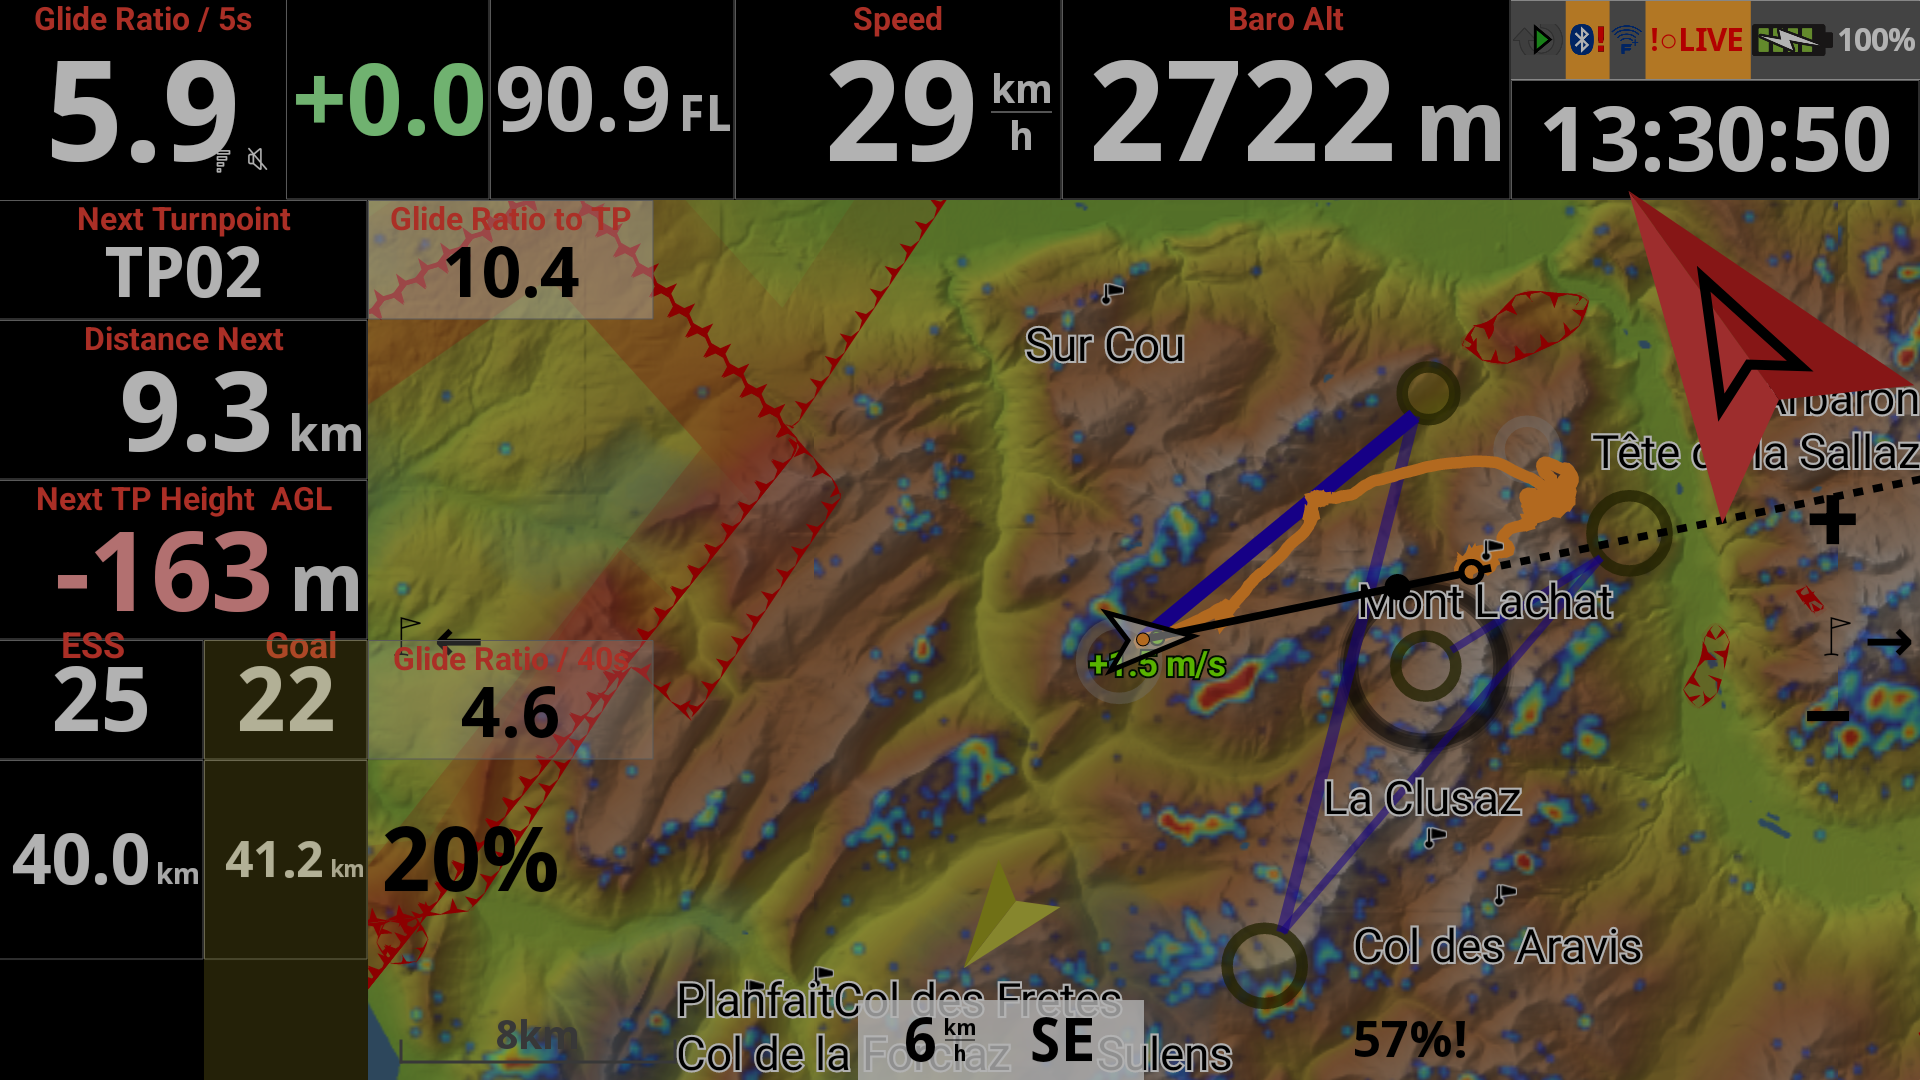
Show navigation
With AIR³, the main arrow indicating the direction of the target is included on every page. To avoid confusion with other map information, navigation is set to “Do not use” on the XC Map widget by default.
If you want to display navigation directly on the map widget, select one of the following modes:
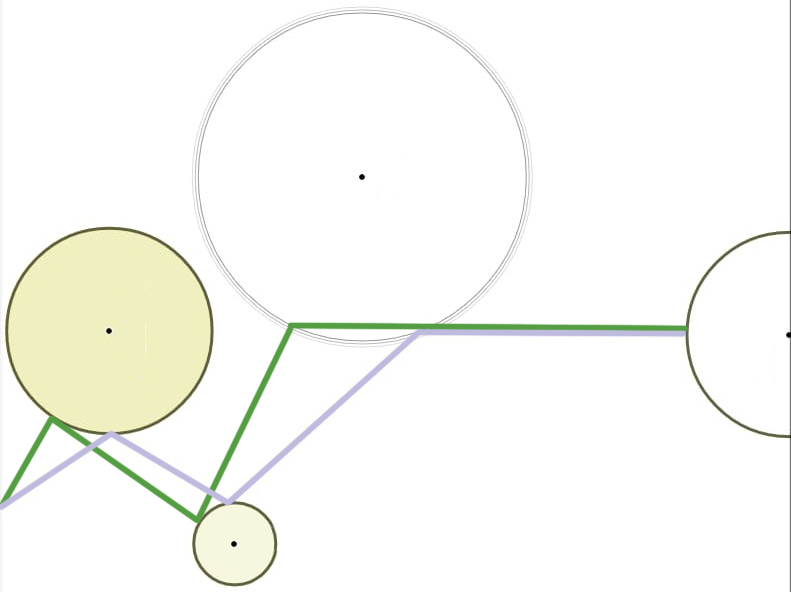
- Point — direction to the exact target. Green line. Distance, glide, time, etc. are calculated to the point itself. Navigation switches to the next point once the circle around the target is reached.
- Optimized point — direction to the optimized point along your route. The most commonly used setting. Blue line.
- Cylinder (nearest point) — direction to the nearest point of the circle. Green line. Distance, glide, time, etc. are calculated to the circle edge, not the center.
- Do not use — no navigation displayed on the map.
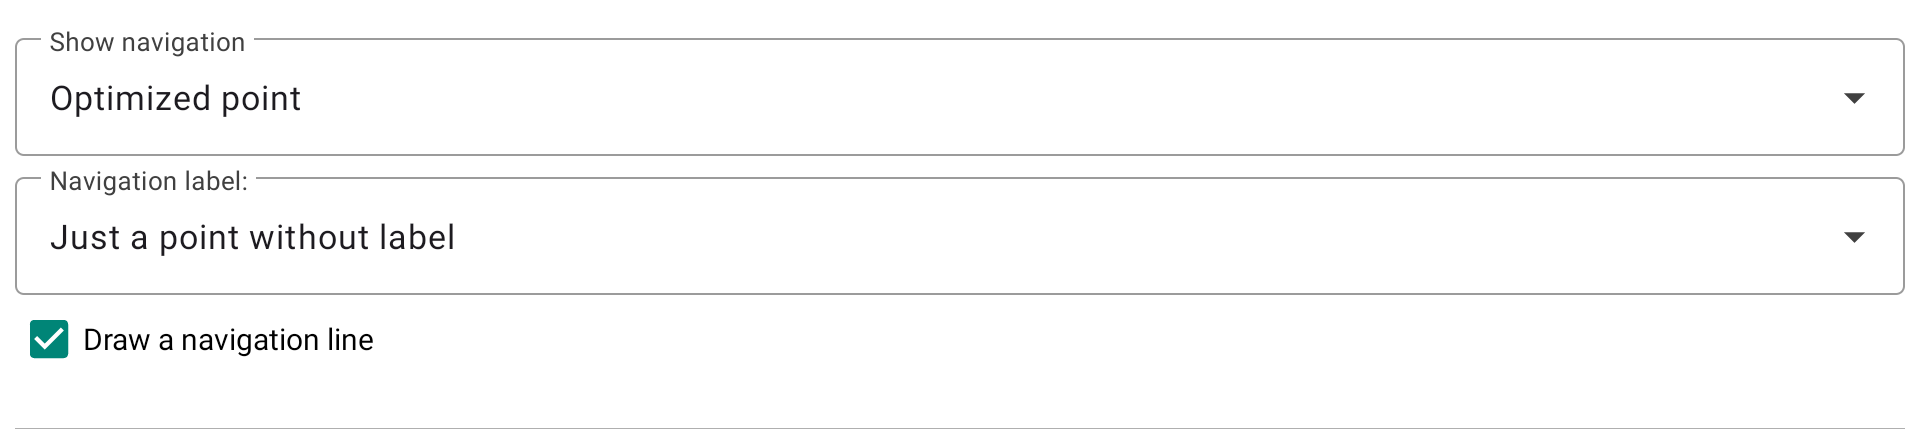
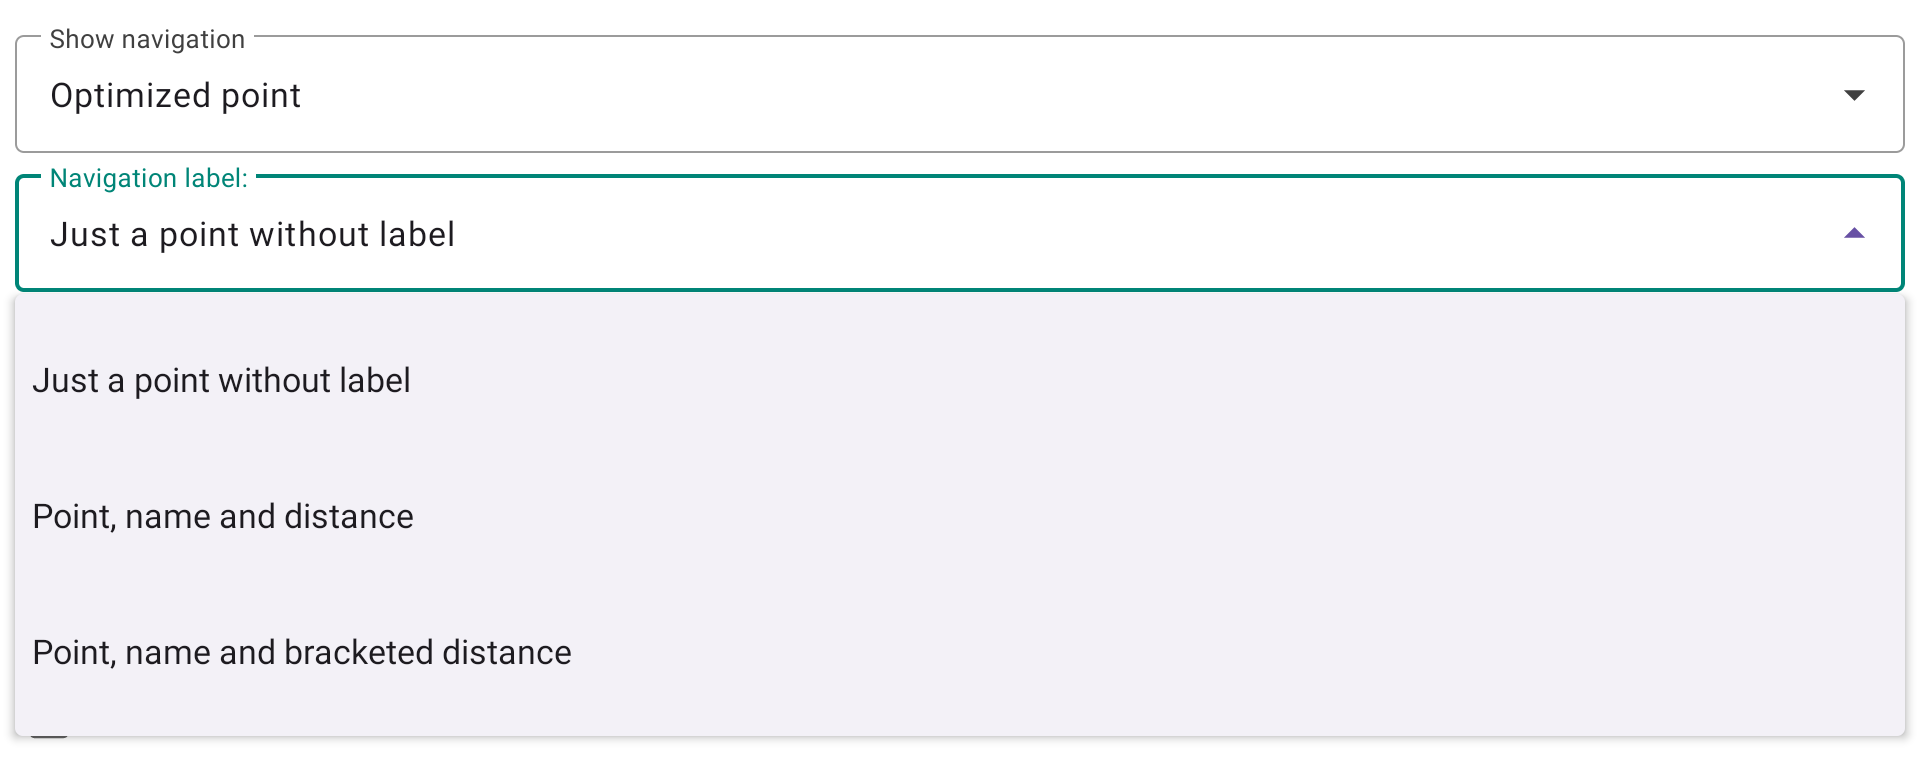
Navigation label
Defines what is displayed next to the navigation target marker on the map. Three options are available:
- Just a point without label — only the target point is shown, with no text.
- Point, name and distance — the target name and distance are displayed next to the point.
- Point, name and bracketed distance — same as above, with the distance shown in brackets.
Draw a navigation line — when enabled, a line is drawn from your current position to the navigation target.
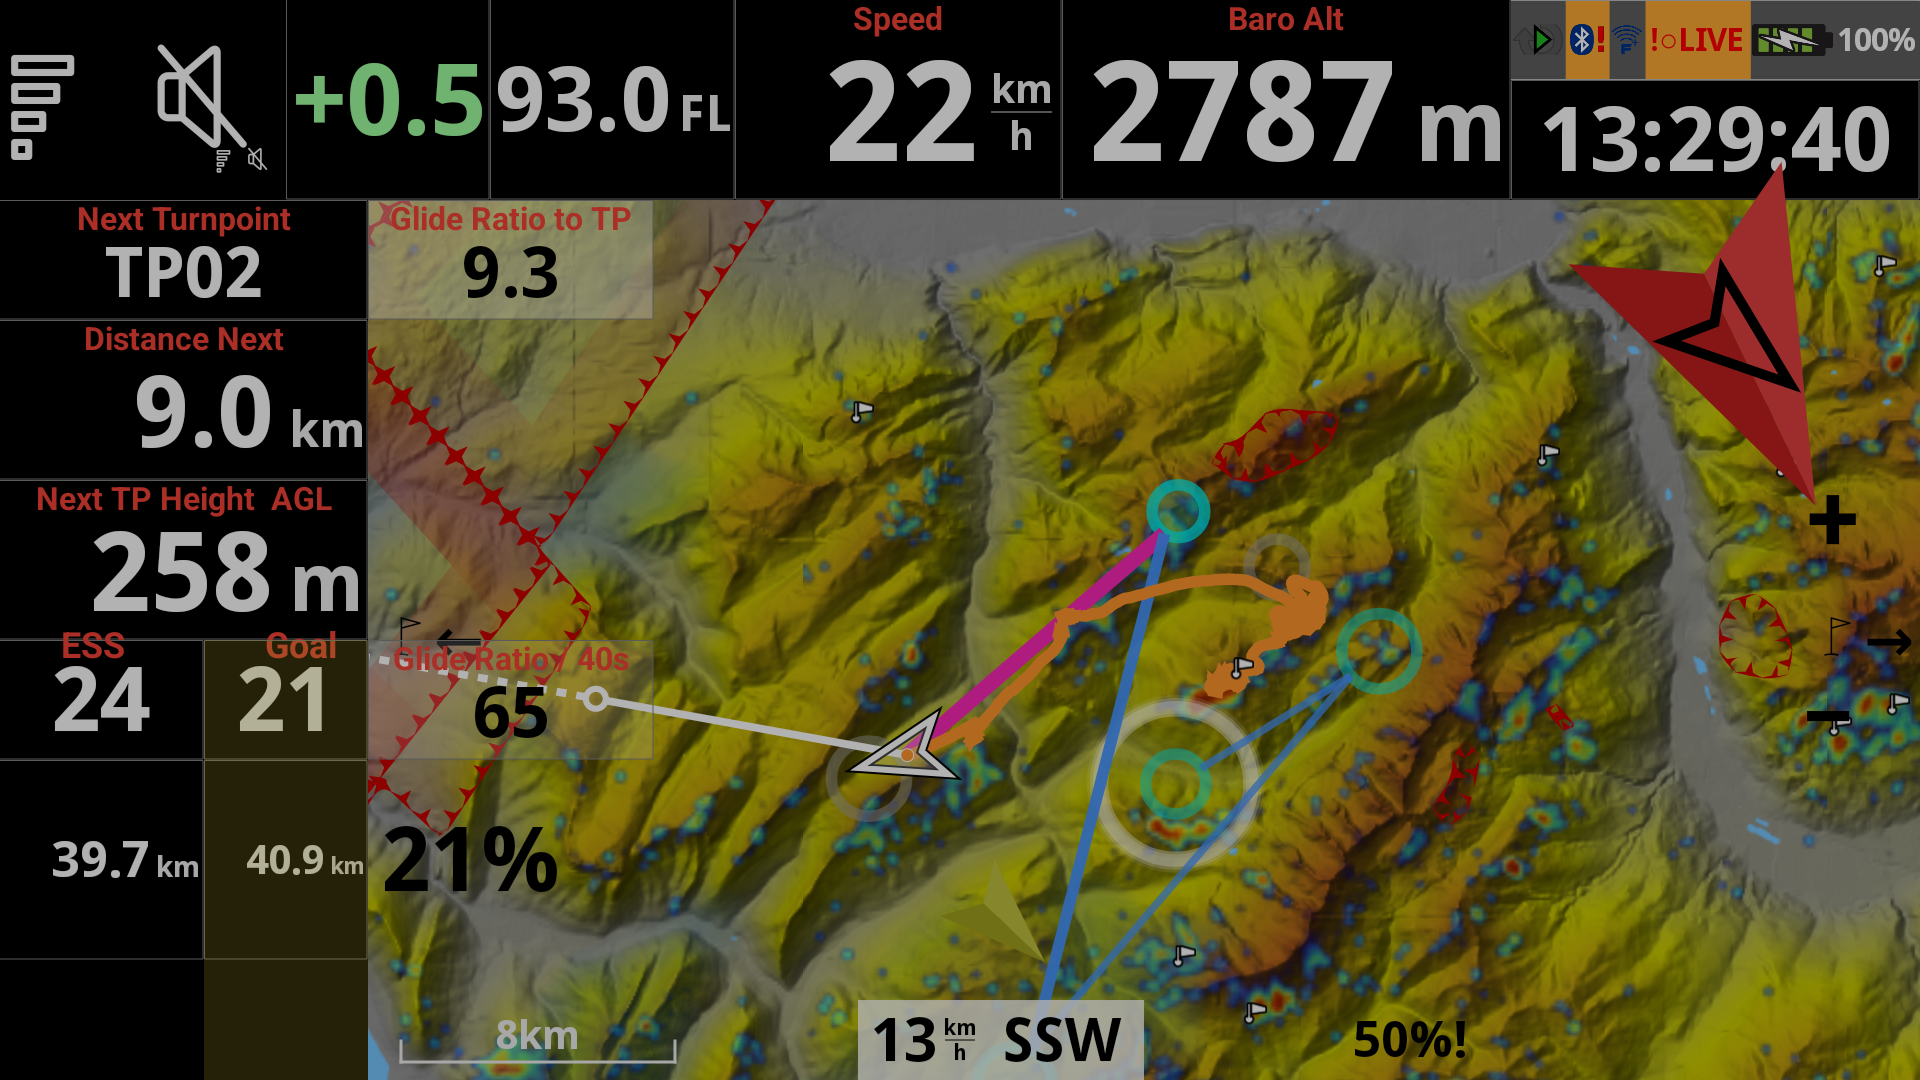
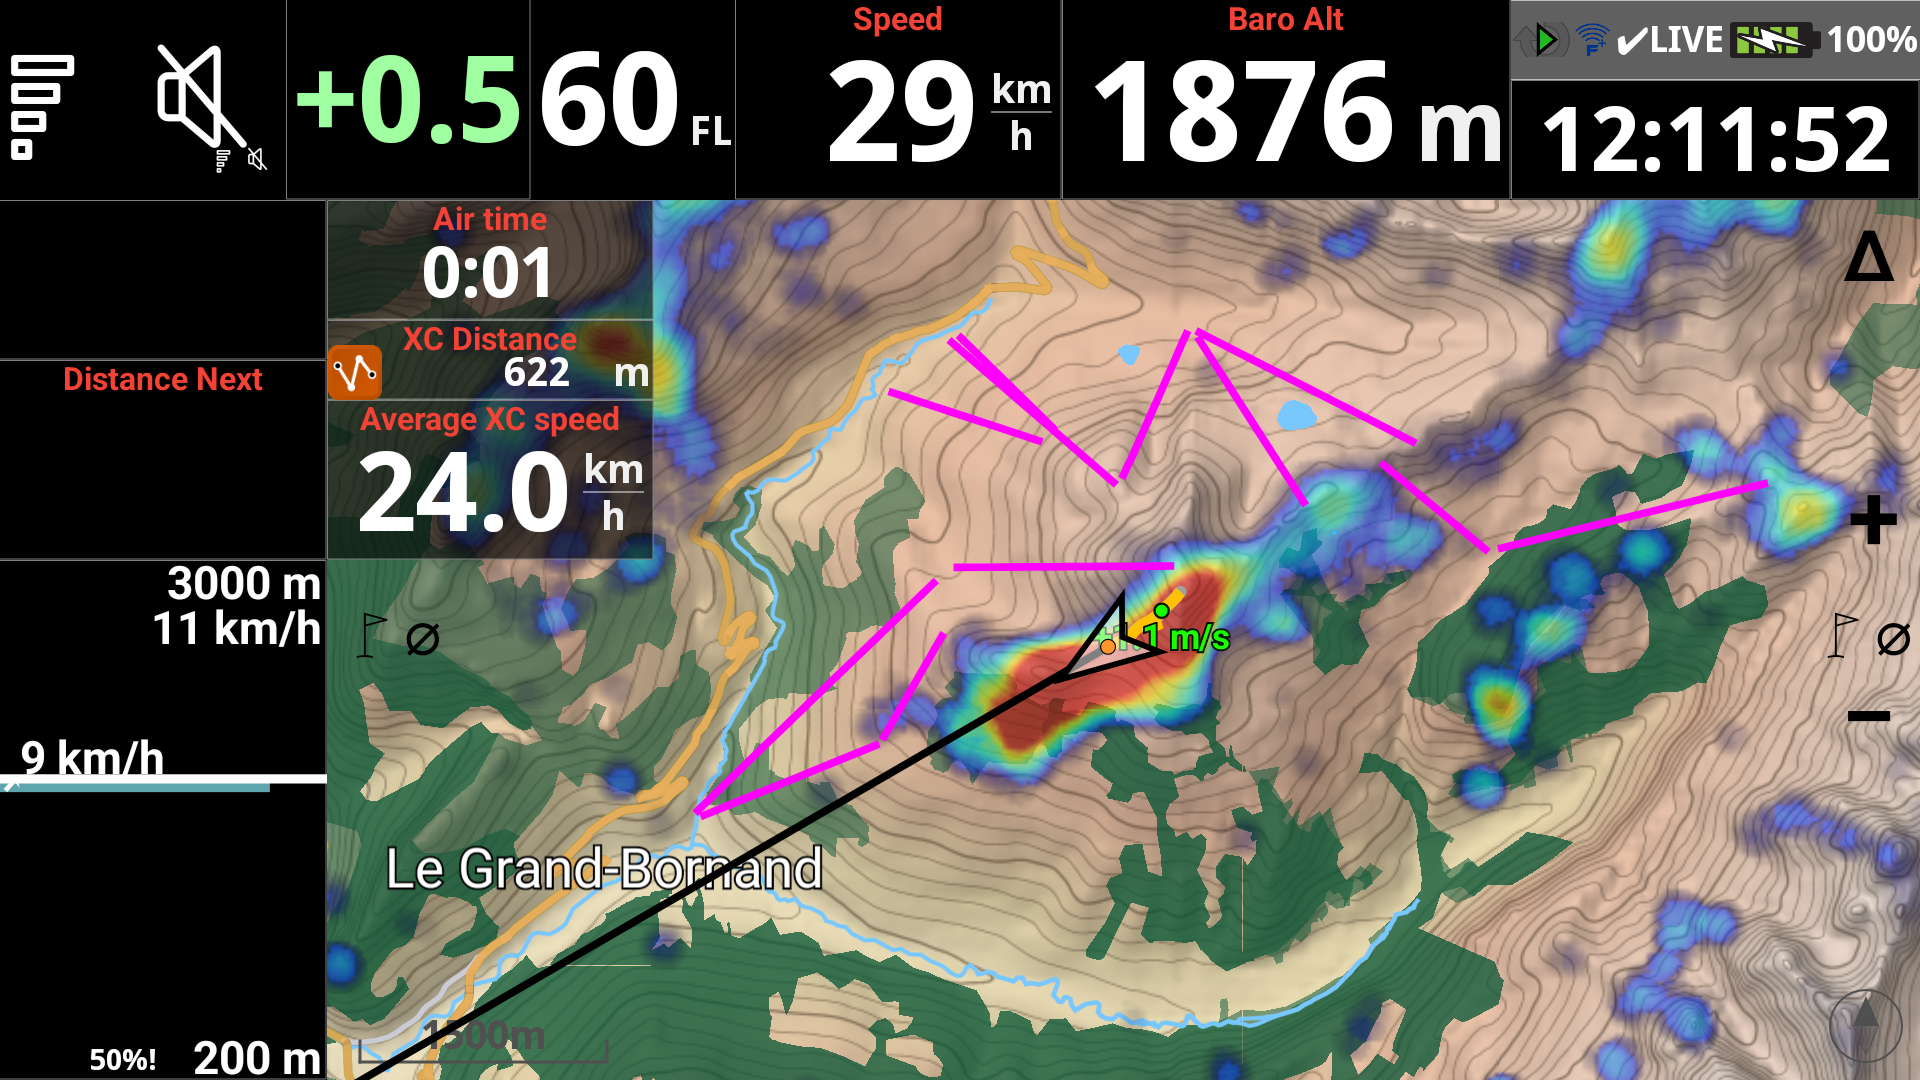
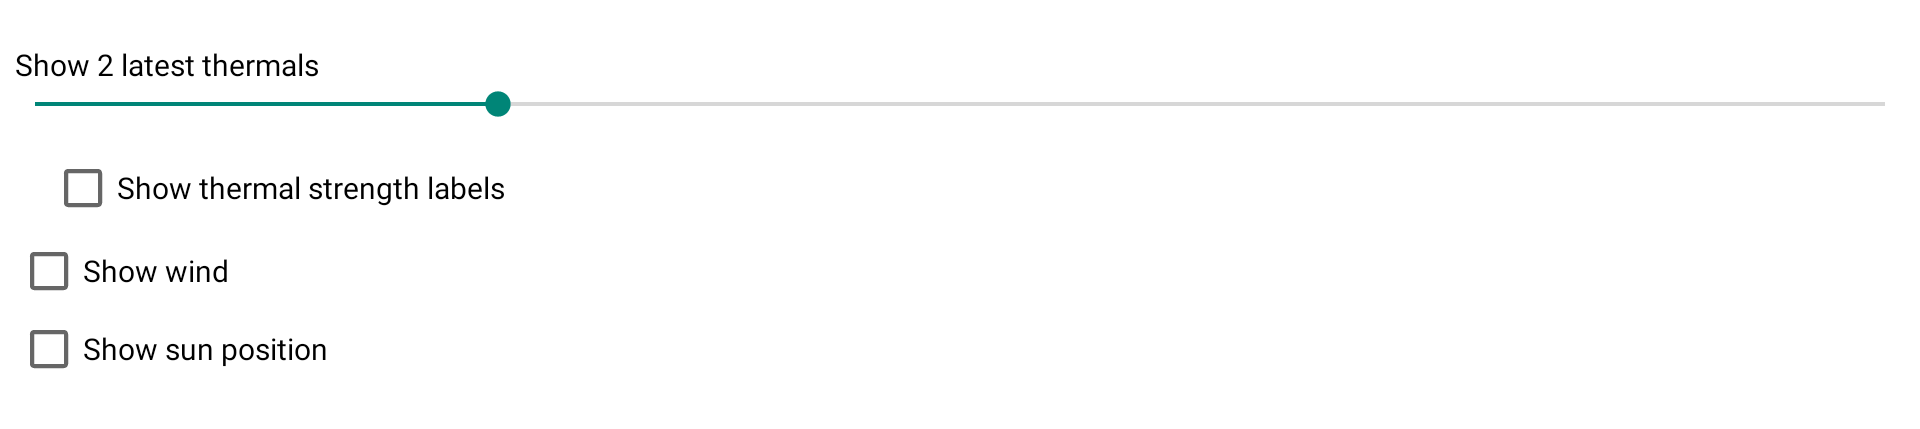
Show lastest thermals
The next slider lets you decide the number of last thermals to show on the map together with its climb rate.
The number corresponds to the average climb and the color depends on that value.
Show wind
Show wind displays a small arrow on the map to indicate the direction, with the speed of the wind. Wind is computed the completion of a full circle.
Show sun position
The sun and the wind display are located on the border of the map widget. If you display also the RoadMap, you may create some mess, not being able to identify information correctly.


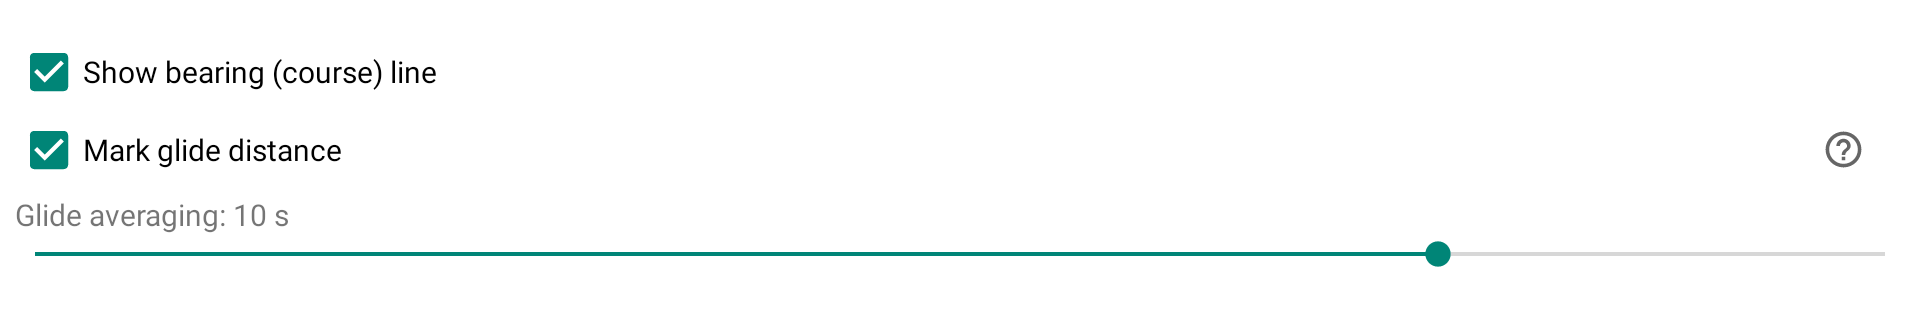
Show bearing line
By disabling “Show bearing (course) line“, the Bearing line in front of the pilot will be removed.
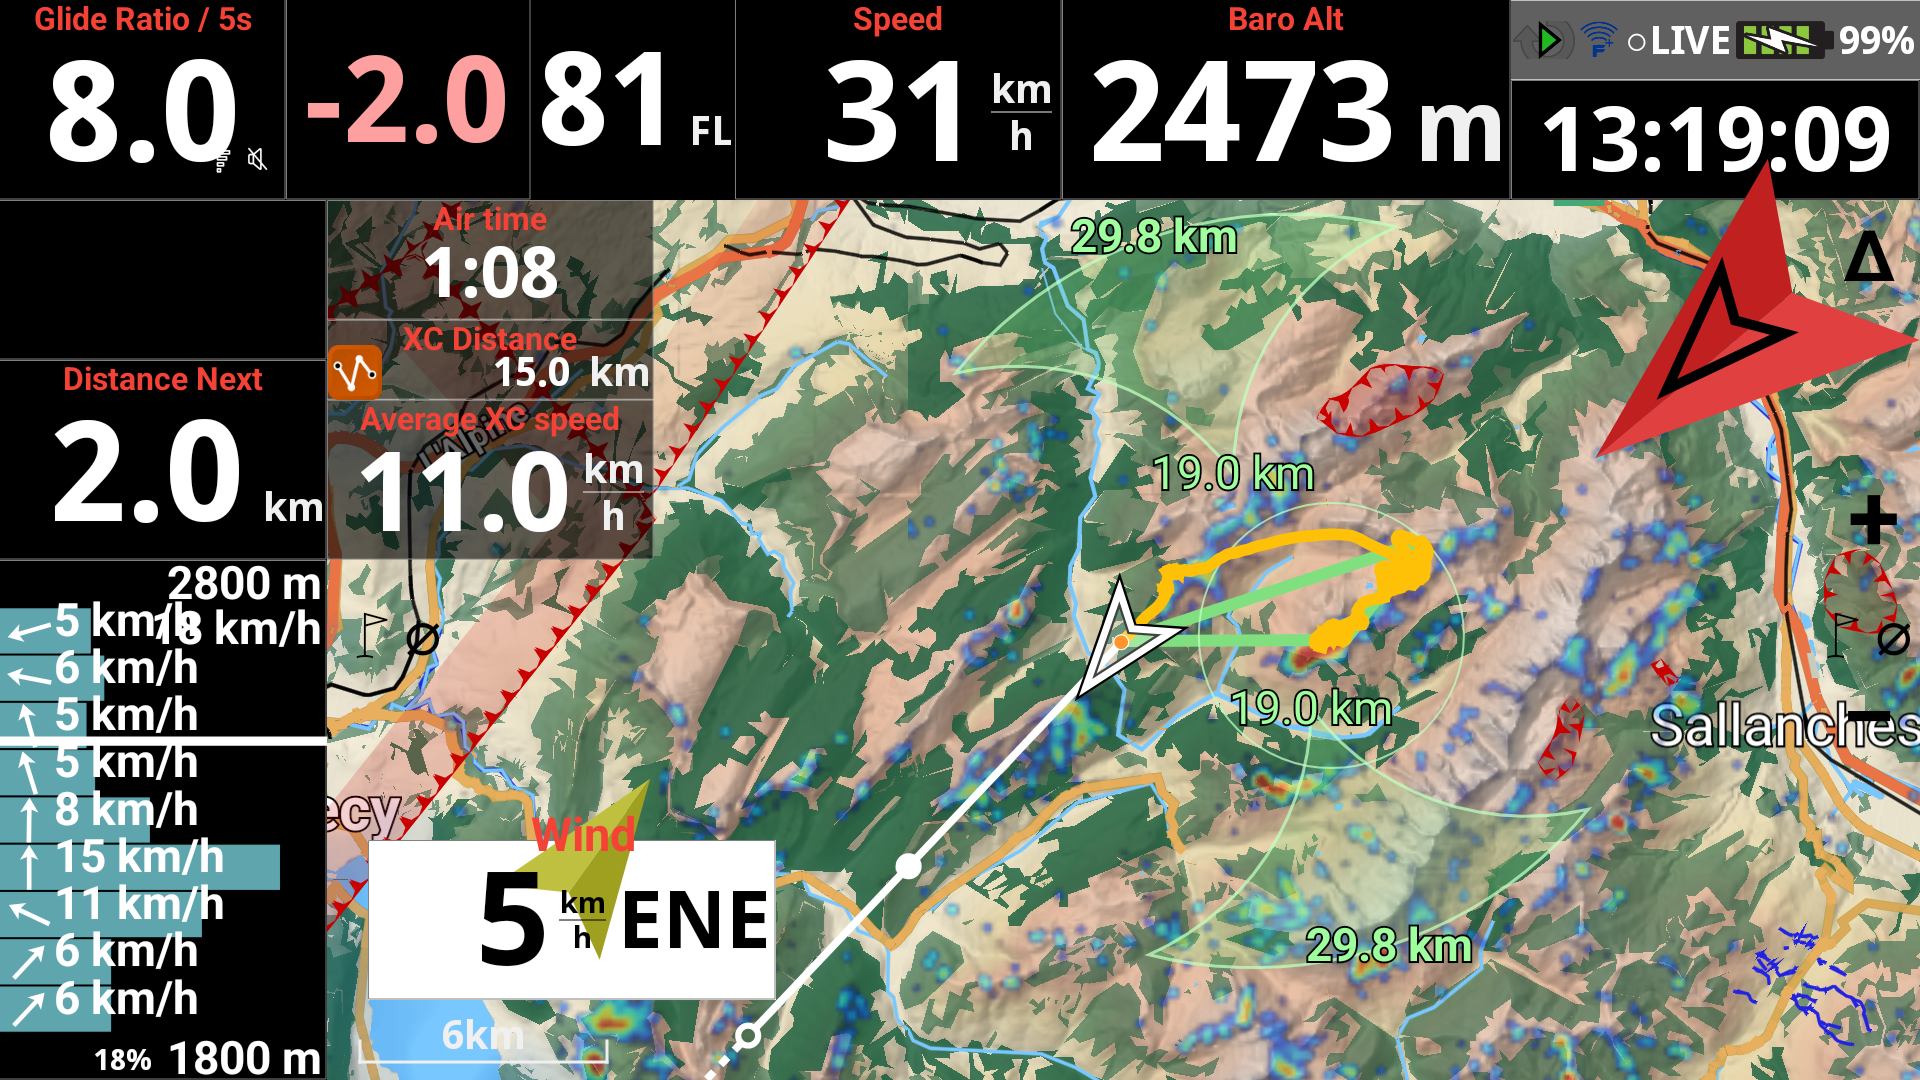
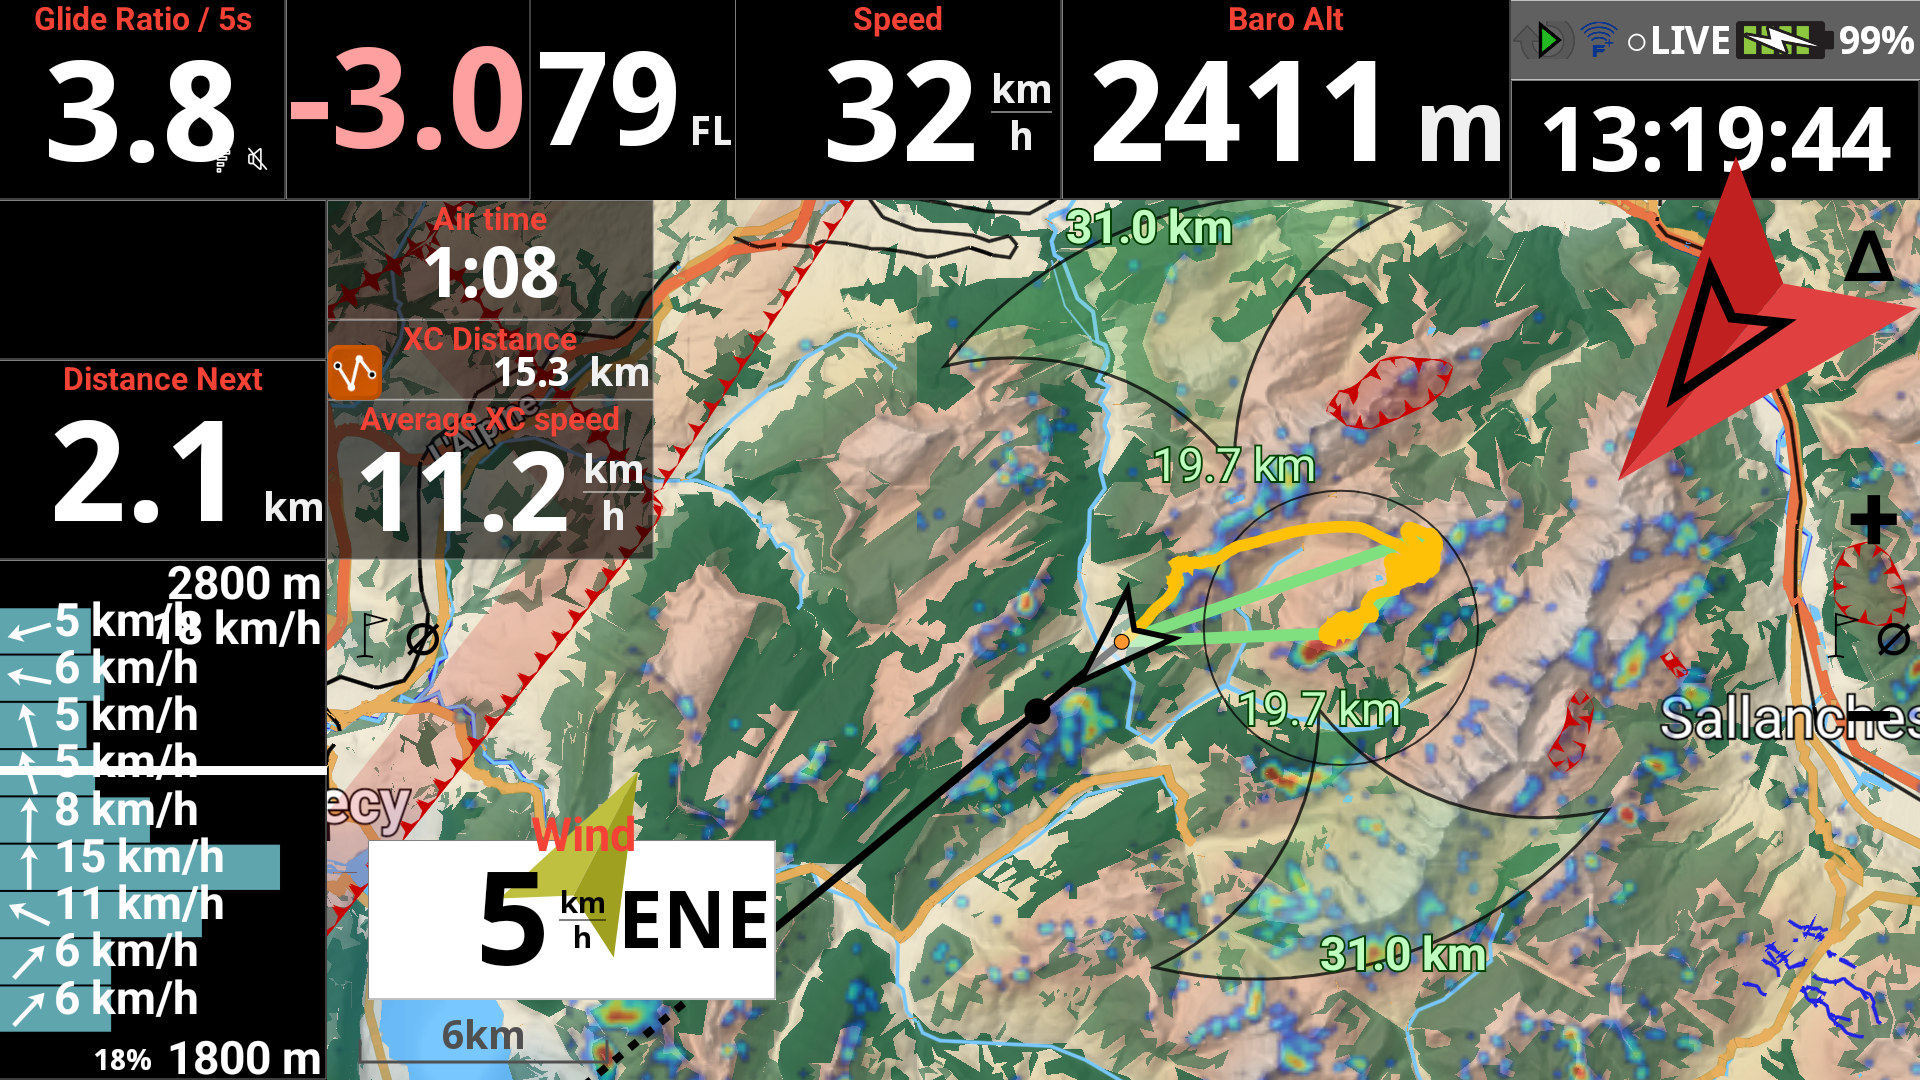
Mark glide distance
If you do not “Mark glide distance“, the Bearing line in front of the pilot will be straight without any other info.
By enabling it, an empty circle will mark glide distance based on the configured glide ratio, trim speed and computed wind.. Solid circle marks glide distance based on the current glide ratio. Read more details about Glider setup in Menu/Preferences/Aircraft.
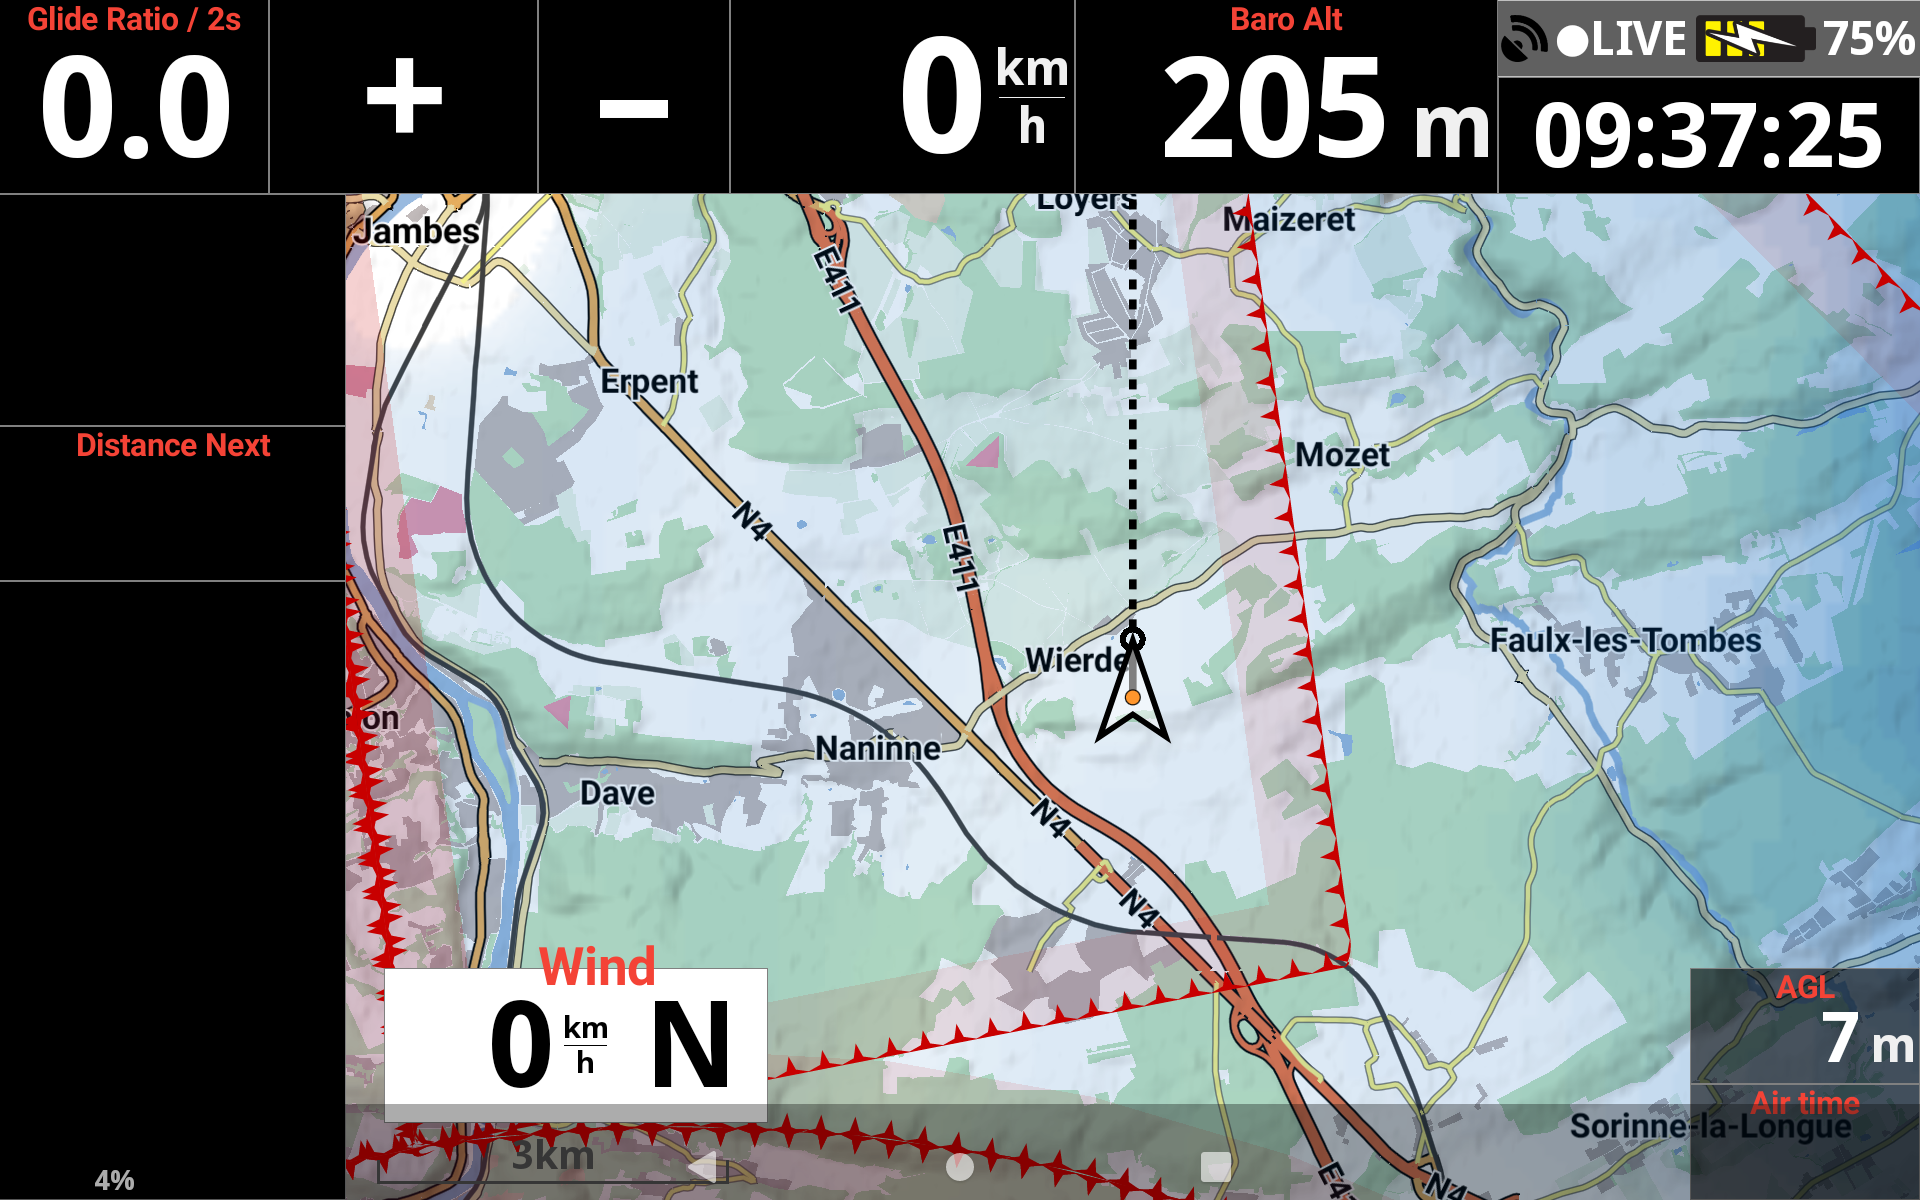
Mark glide distance disabled

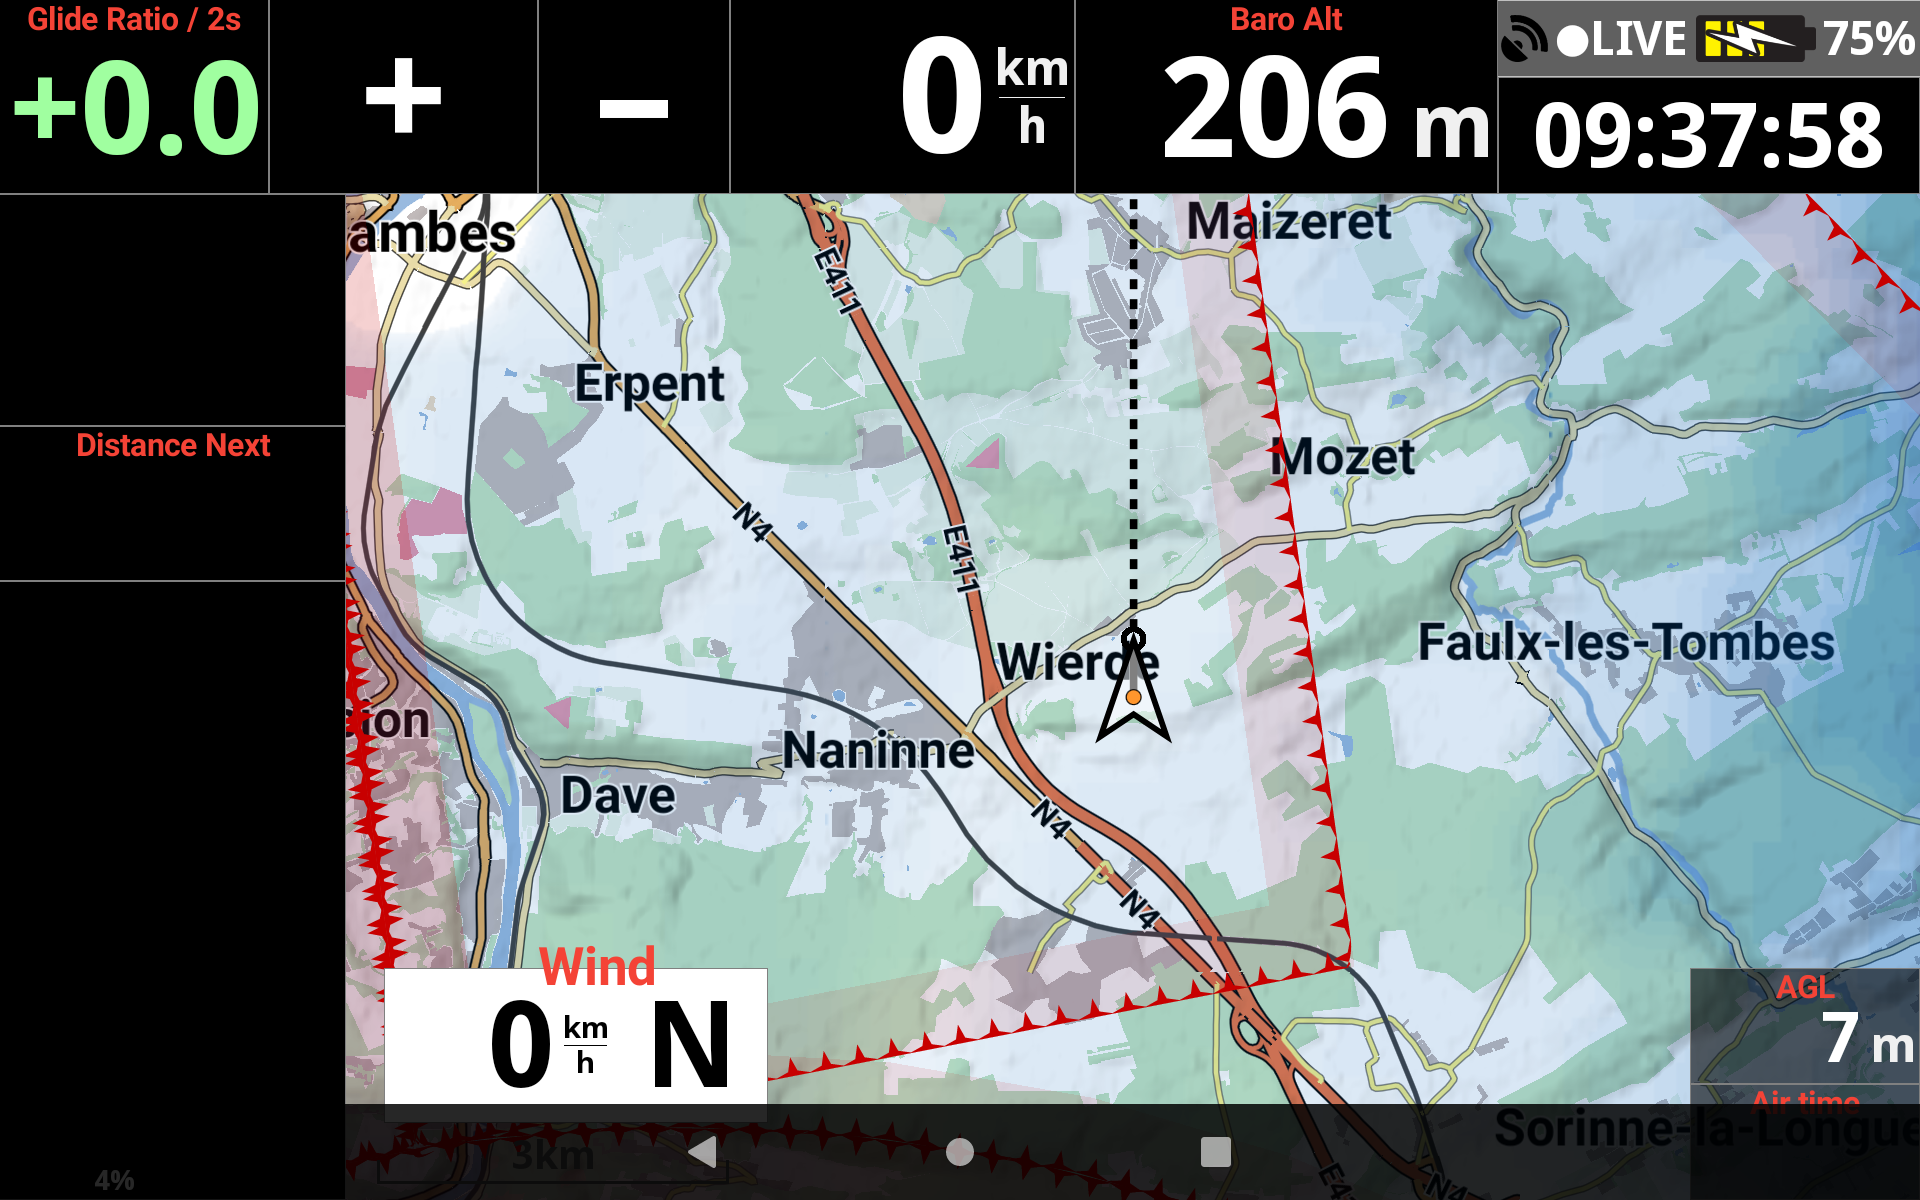
Mark glide distance enabled

Thickness of lines
The thickness of lines will determine the thickness of the track on the map as well as the thickness of the line showing the Bearing direction in front of the pilot.
If you have the Pro version, you can change the color of the tracklog.
You can modify the Pilot arrow size to better identify the current heading by increasing the coefficient.
Depending on the wind direction and strength, you can therefore better visualize at any moment the Heading (Pilot arrow) and the Bearing (Line in front of the pilot).
By default, XCTrack uses the Bearing/track direction thanks to the GPS, the wind speed and direction to compute the Heading direction.
By enabling “Use internal compass” in Menu/Preferences/Connection & sensors, XCTrack uses the information coming from the internal compass to display the Heading.
Read more details on using the internal compass in the Preferences page of XCTrack Pro manual.
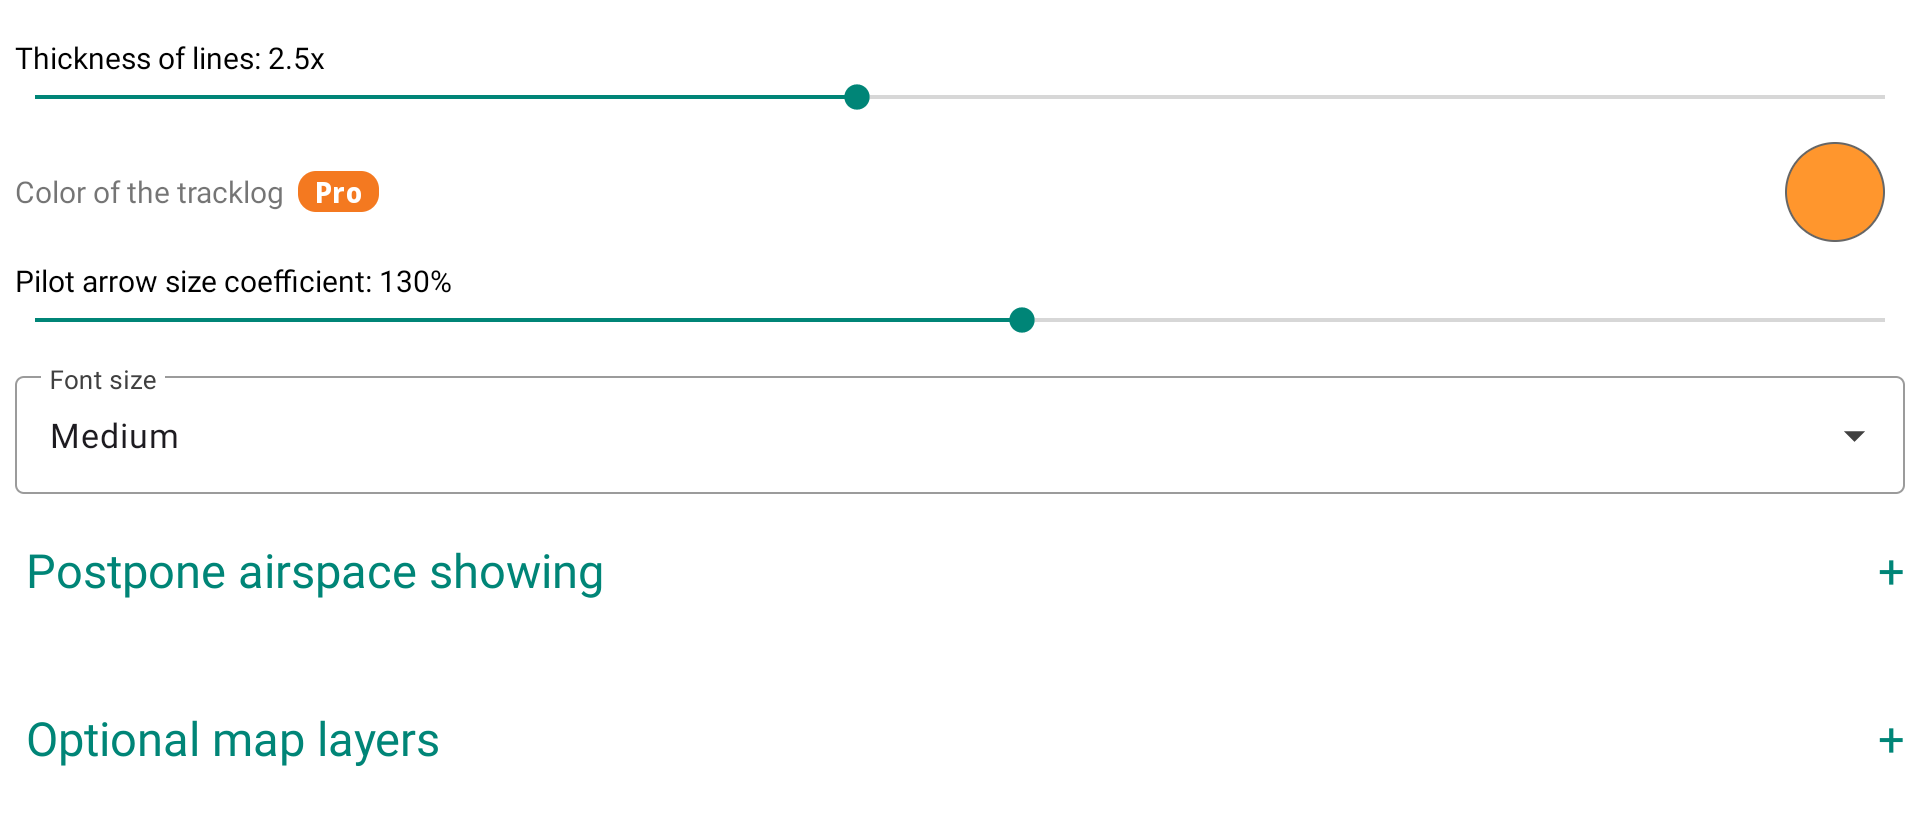

Font Size
You can choose between small, medium or large. This parameter has a direct influence on all textual information other than that directly included with the Roadmaps, such as waypoint name, Airspace info, …
If you want to change the display size of the cities that are included with the Roadmaps, read this FAQ.
By setting in the map configuration to display airspaces, the airspace whose floor is above the set limit can be deferred. Approaching a set distance, the deferred airspace can be displayed.
By using the expert mode of AIR³, a dedicated page is available for airspaces management.
If you are interested to know more about Airspaces with AIR³, watch the dedicated tuto video in the videos’ page and read more details about Airspaces in Menu/Preferences/Airspaces

Next section: