This page gives details on the widgets that are in the “Xcontest” subsection. They can be accessed by customizing the XCTrack Pro pages pre-installed on AIR³. Remember that your customisations will be lost if you reset XCTrack Pro interface with AIR³ Manager, if you change the profile (Kiss, Easy, Expert, Paramotor) or if you load a different configuration file ‘xcfg’.
Click on the + sign to read the details.
Show navigation
With AIR³, the main arrow indicating the direction of the target is included on every page. To avoid confusion with other map information, navigation is set to "Do not use" on the XC Map widget by default.
If you want to display navigation directly on the map widget, select one of the following modes:
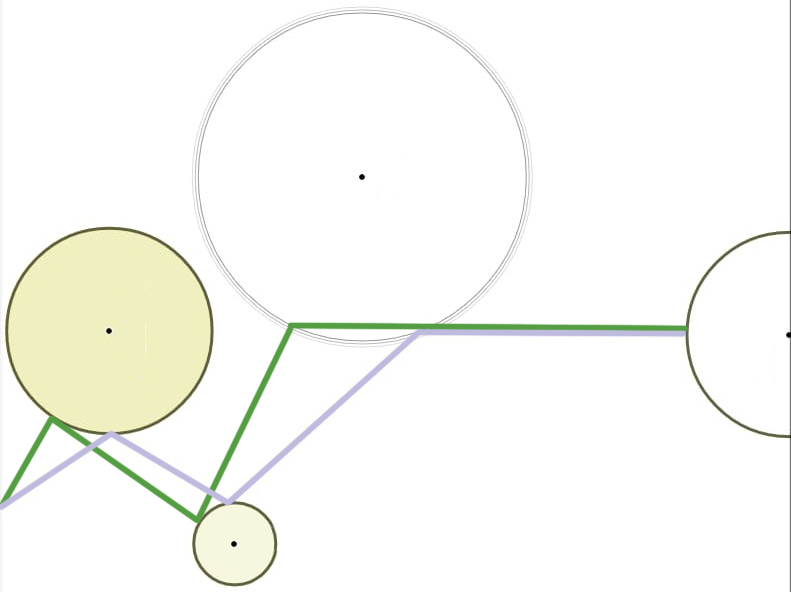
- Point — direction to the exact target. Green line. Distance, glide, time, etc. are calculated to the point itself. Navigation switches to the next point once the circle around the target is reached.
- Optimized point — direction to the optimized point along your route. The most commonly used setting. Blue line.
- Cylinder (nearest point) — direction to the nearest point of the circle. Green line. Distance, glide, time, etc. are calculated to the circle edge, not the center.
- Do not use — no navigation displayed on the map.
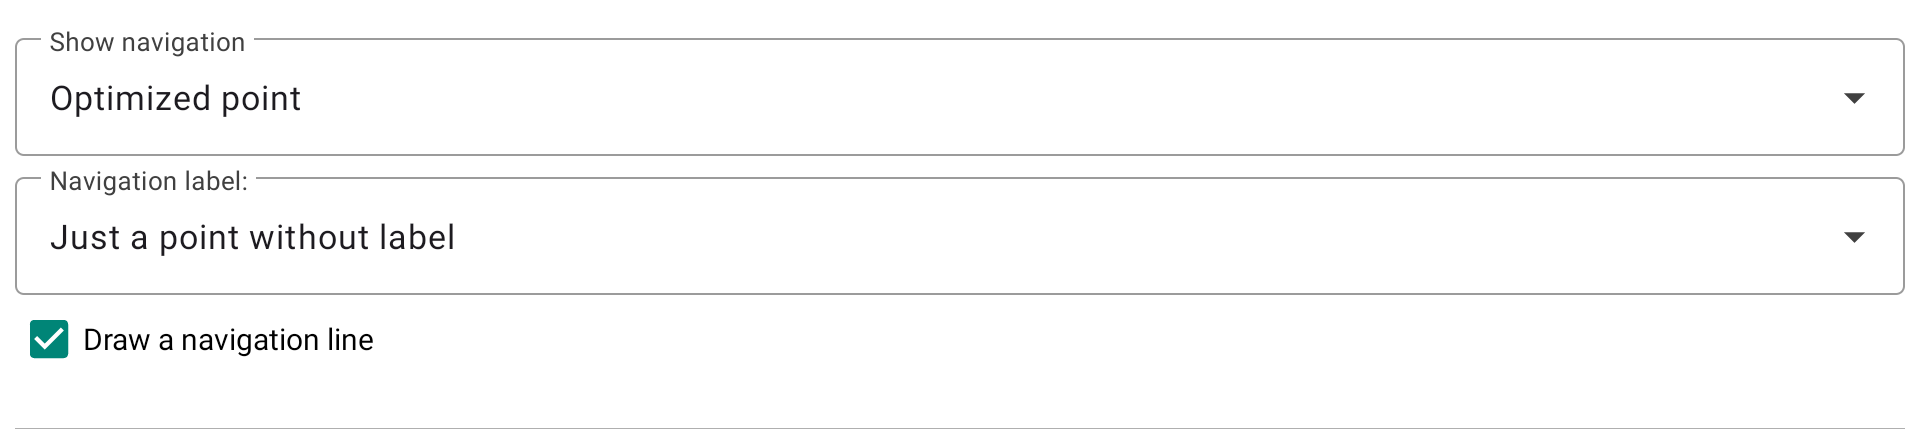
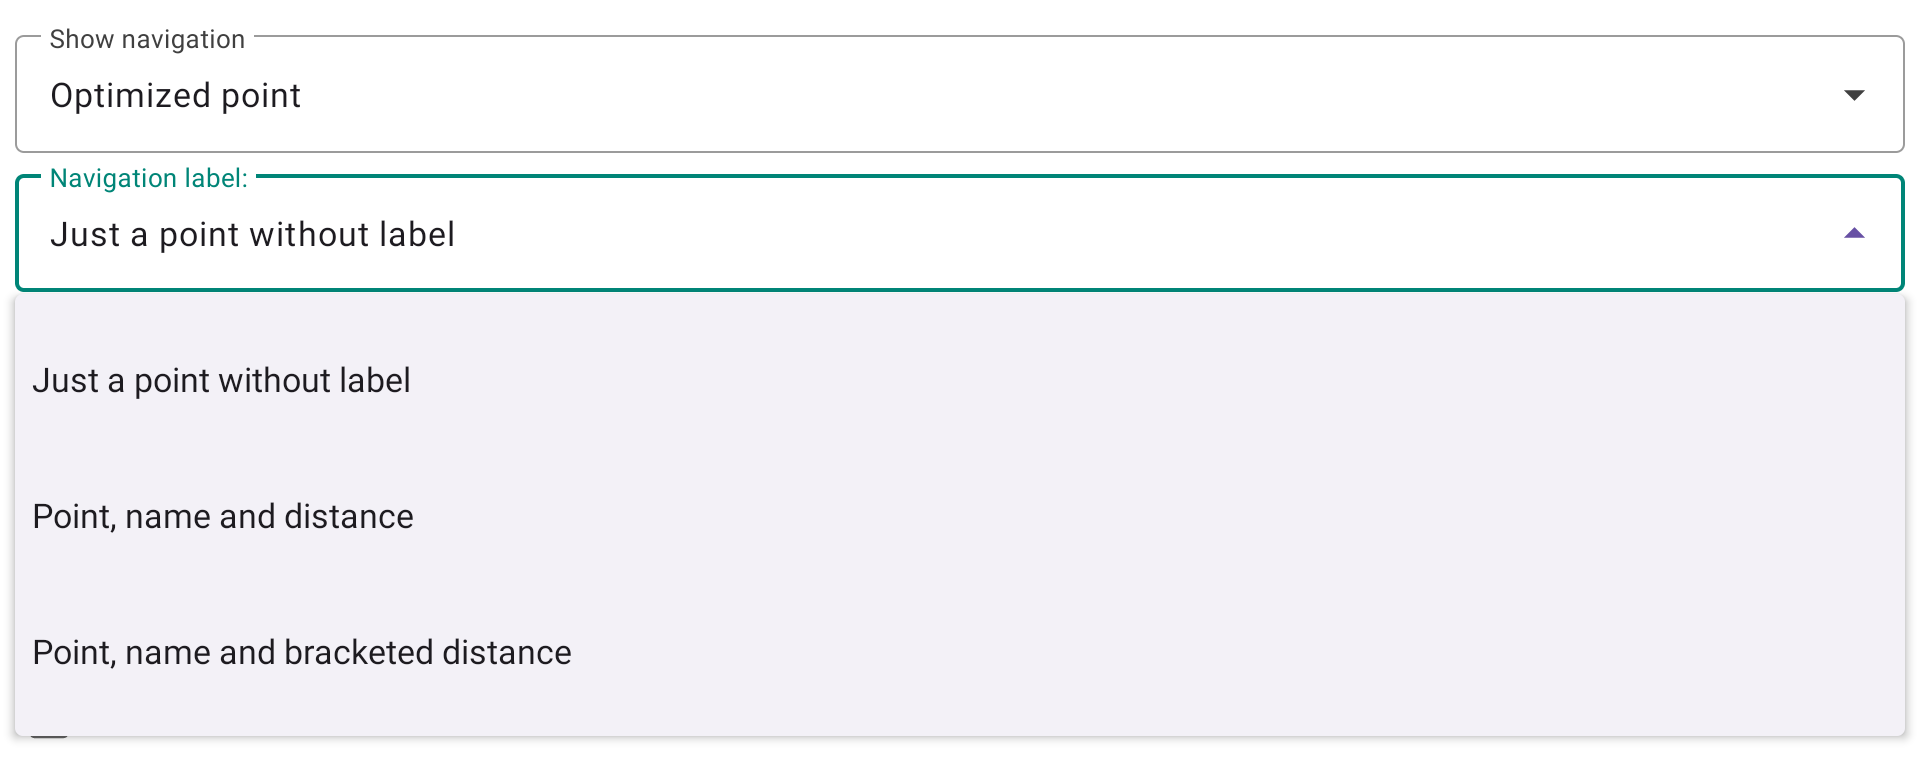
Navigation label
Defines what is displayed next to the navigation target marker on the map. Three options are available:
- Just a point without label — only the target point is shown, with no text.
- Point, name and distance — the target name and distance are displayed next to the point.
- Point, name and bracketed distance — same as above, with the distance shown in brackets.
Draw a navigation line — when enabled, a line is drawn from your current position to the navigation target.
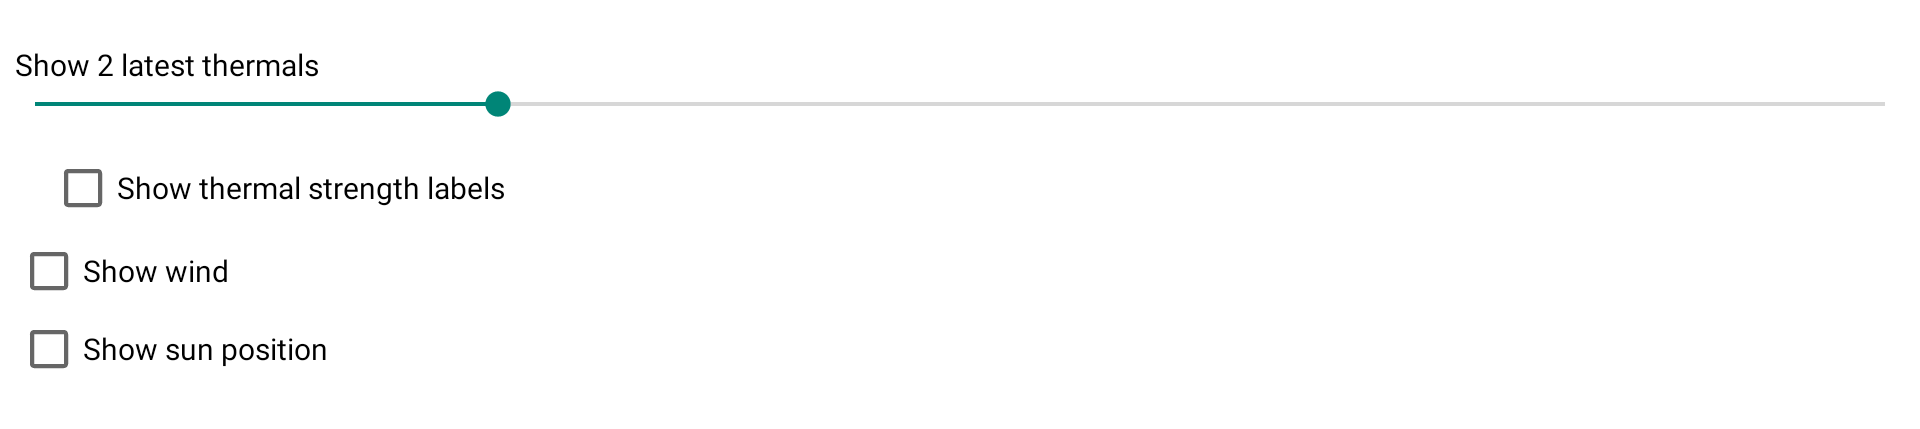
Show lastest thermals
The next slider lets you decide the number of last thermals to show on the map together with its climb rate.
The number corresponds to the average climb and the color depends on that value.
Show wind
Show wind displays a small arrow on the map to indicate the direction, with the speed of the wind. Wind is computed the completion of a full circle.
Show sun position
The sun and the wind display are located on the border of the map widget. If you display also the RoadMap, you may create some mess, not being able to identify information correctly.


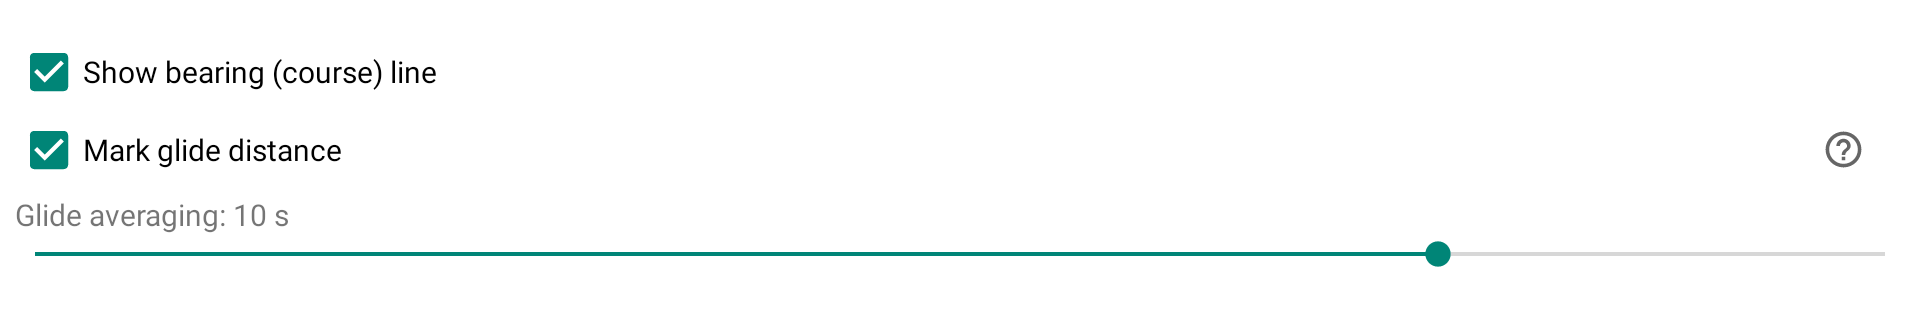
Show bearing line
By disabling “Show bearing (course) line“, the Bearing line in front of the pilot will be removed.
Mark glide distance
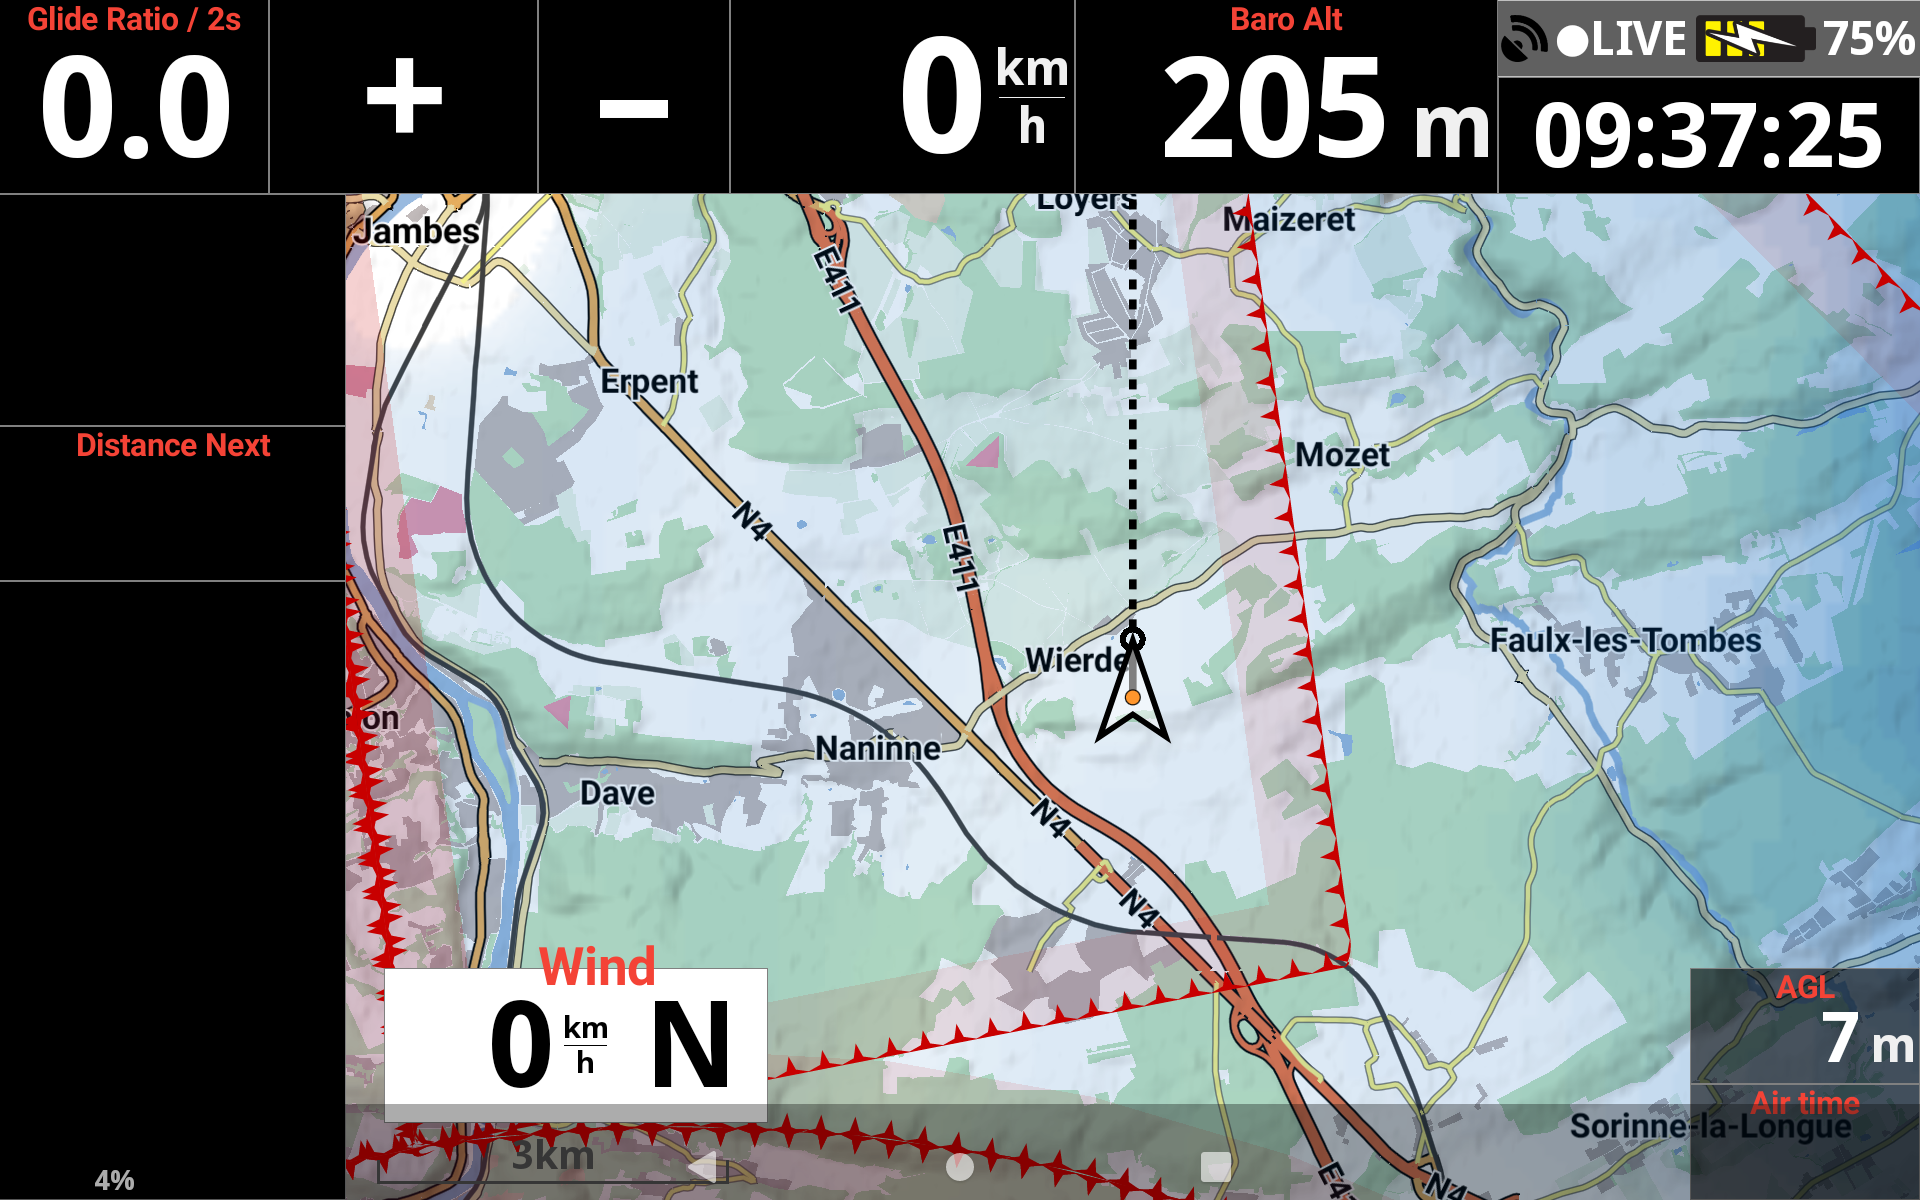
If you do not “Mark glide distance“, the Bearing line in front of the pilot will be straight without any other info.
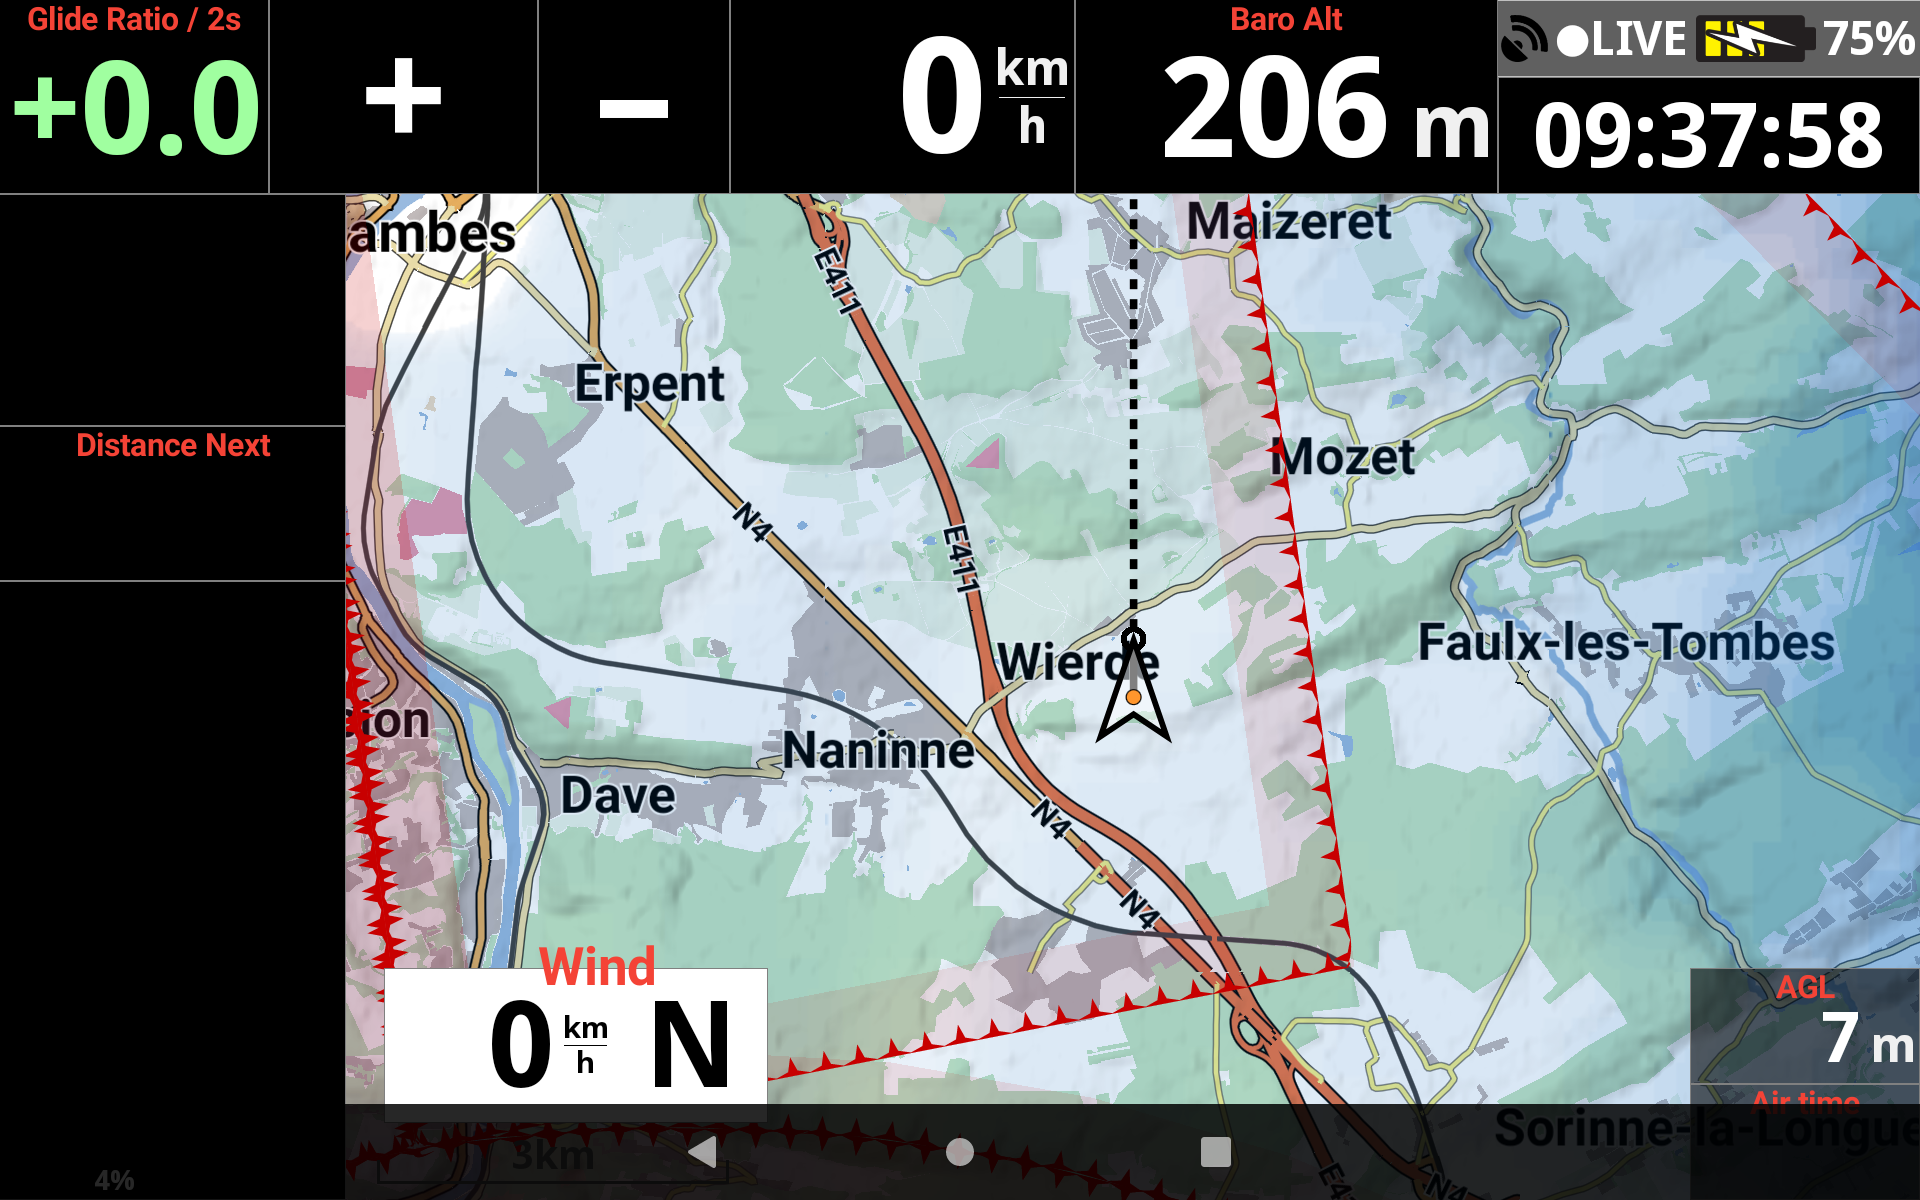
By enabling it, an empty circle will mark glide distance based on the configured glide ratio, trim speed and computed wind.. Solid circle marks glide distance based on the current glide ratio. Read more details about Glider setup in Menu/Preferences/Aircraft.
Mark glide distance disabled

Mark glide distance enabled

Thickness of lines
The thickness of lines will determine the thickness of the track on the map as well as the thickness of the line showing the Bearing direction in front of the pilot.
If you have the Pro version, you can change the color of the tracklog.
You can modify the Pilot arrow size to better identify the current heading by increasing the coefficient.
Depending on the wind direction and strength, you can therefore better visualize at any moment the Heading (Pilot arrow) and the Bearing (Line in front of the pilot).
By default, XCTrack uses the Bearing/track direction thanks to the GPS, the wind speed and direction to compute the Heading direction.
By enabling “Use internal compass” in Menu/Preferences/Connection & sensors, XCTrack uses the information coming from the internal compass to display the Heading.
Read more details on using the internal compass in the Preferences page of XCTrack Pro manual.
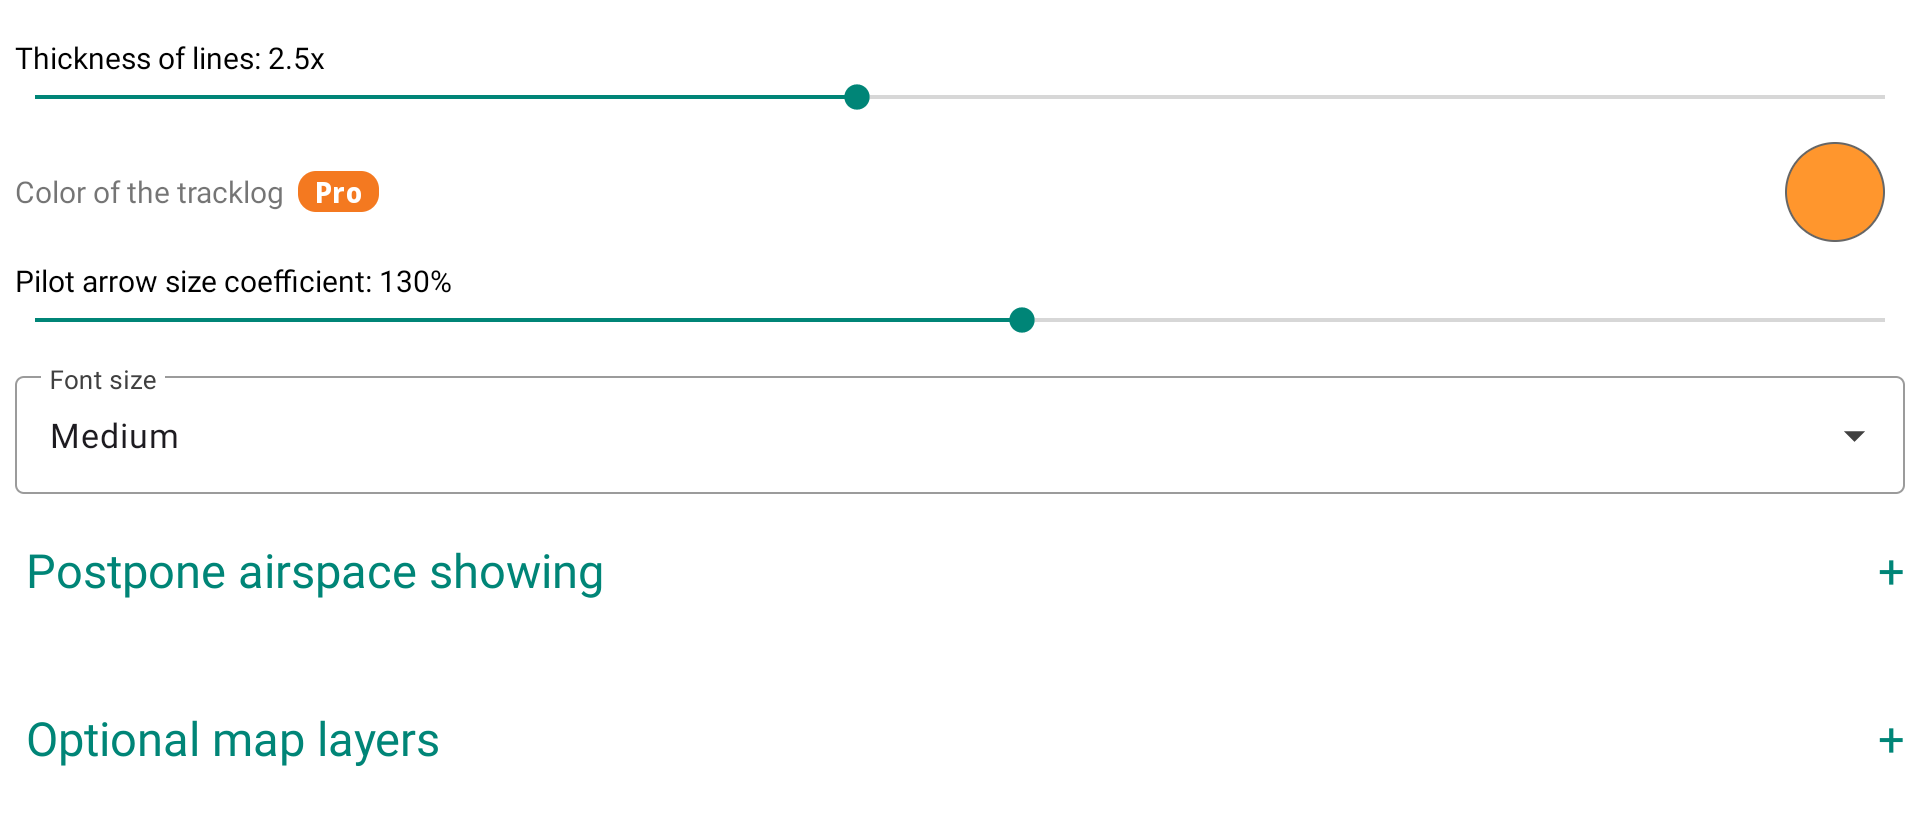

Font Size
You can choose between small, medium or large. This parameter has a direct influence on all textual information other than that directly included with the Roadmaps, such as waypoint name, Airspace info, ...
If you want to change the display size of the cities that are included with the Roadmaps, read this FAQ.
By setting in the map configuration to display airspaces, the airspace whose floor is above the set limit can be deferred. Approaching a set distance, the deferred airspace can be displayed.
By using the expert mode of AIR³, a dedicated page is available for airspaces management.
If you are interested to know more about Airspaces with AIR³, watch the dedicated tuto video in the videos’ page and read more details about Airspaces in Menu/Preferences/Airspaces

In the Optional map layers section, you can overlay additional data layers on top of the map.
Rain radar (Pro)
When enabled, displays live rain radar data as an overlay on the map, allowing you to anticipate precipitation and adjust your flight accordingly. Requires an internet connection to fetch the data.
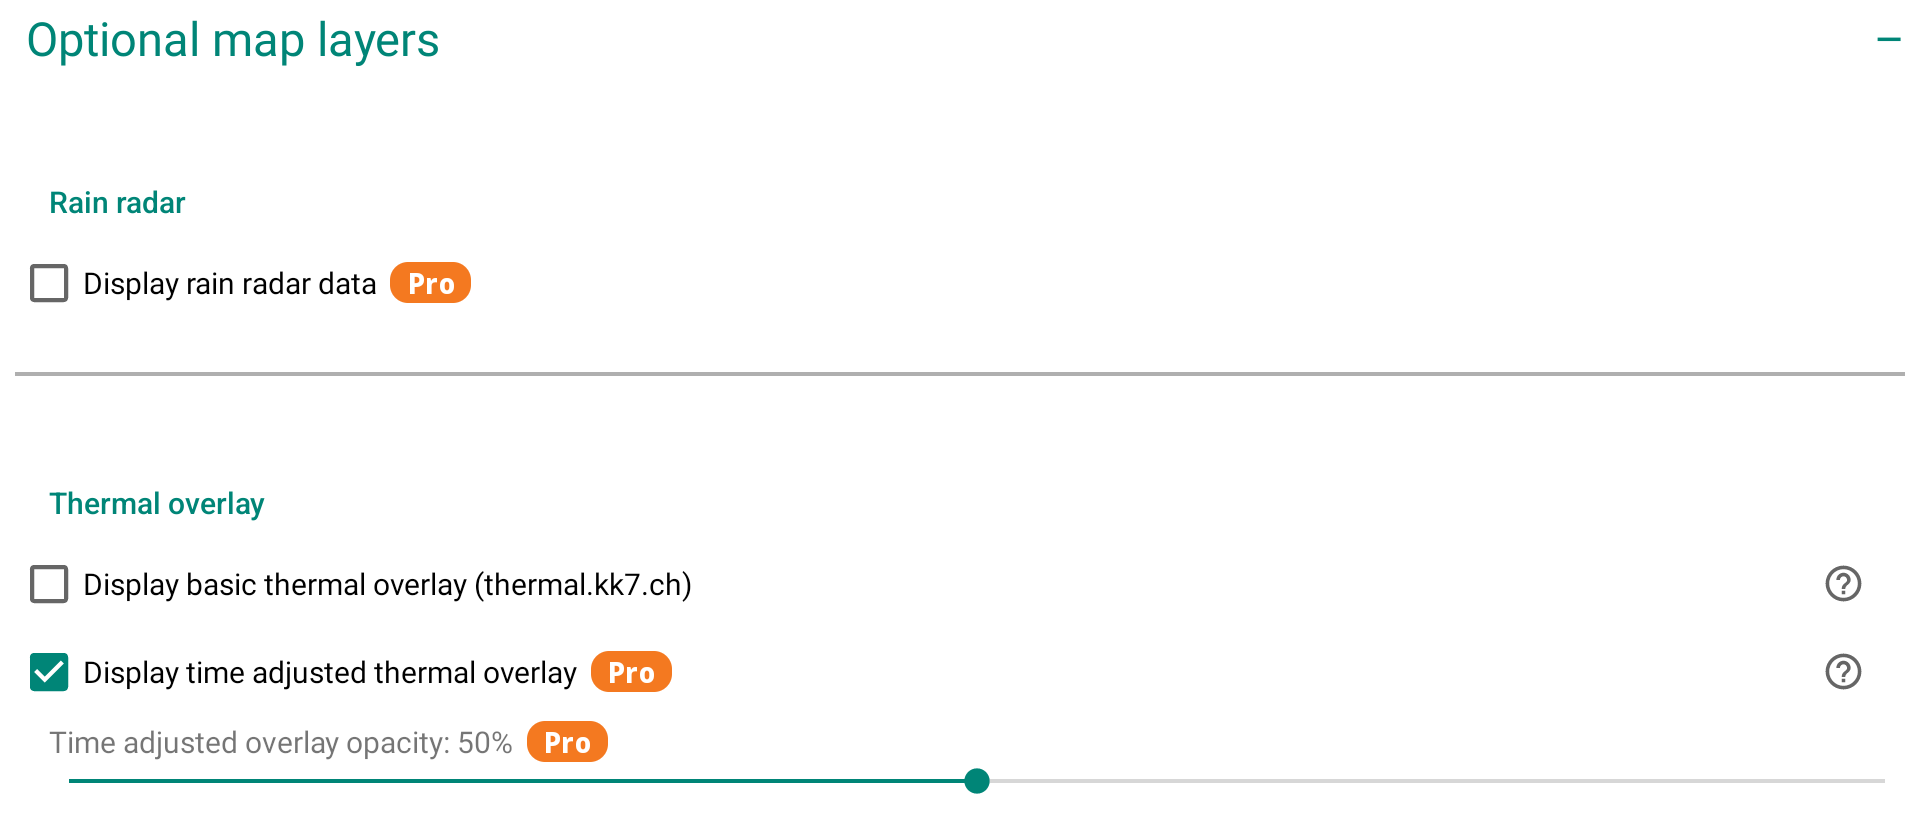
Thermal overlay
Thermal overlay (or also called thermal map) shows the probability to find a thermal uplift at a certain geographical location using a paraglider. The thermal maps are solely based on real flights and void of any model data. Data come from thermal.kk7.ch.
To be clear, the thermal map is a map of thermals calculated by analysing a large number of flights. It doesn’t correspond to the thermals associated with the current weather situation you have on any given day.
Once you have enabled the Thermal Map option, you will need an Internet connection to allow XCTrack to download the information for the area being displayed. Once downloaded, you won’t need an internet connection. However, if you move to a different location without an Internet connection, you won’t be able to get the information for the new area. In other words, you don’t need an in-flight connection to get the thermal map overlay if you’ve prepared your flight while connected, but it’s much easier if you have an in-flight connection.
All thermal maps correspond to a location on the ground where the thermal would originate from. Depending on your altitude, you need to determine thermal drift based on wind speed and direction.

“Display basic thermal overlay” provides information about possible thermal uplifts without any filtering (day of the year and the time of the day).
“Display time adjusted thermal overlay” provides information about possible thermal uplifts adjusted to cover current season and time of the day. For example, you can expect finding thermal uplifts in the morning from an east-facing slope and nothing on a west-facing one. However, as the data come from real flights, including flights which may have occurred on a west facing slope in the morning, thanks to a westerly wind…this will not always show up as previously mentioned.
You can easily observe these data in thermal.kk7.ch
If you select “Time filter”, you can see at a specific geographical location the change according to the day of the year and the time of the day.
By adjusting the opacity of both options, you can for example display the basic thermal overlay with a low opacity value that will always give you some info about the general situation, in the background…. and activate with a higher value of opacity the adjusted thermal overlay.
Thanks to the very bright color screen of AIR³, you can easily take advantage of this feature.
Example of a West-facing take-off site.
The AIR³ on top has been set to only Display time adjusted thermal overlay.
The AIR³ in the bottom has been set with a low opacity value to display the basic thermal overlay and a higher opacity value for the display of the time adjusted thermal overlay.

Example of a East-facing take-off site.
The AIR³ on top has been set to only Display time adjusted thermal overlay. As the flight is in the evening, there is no possible time adjusted thermal uplifts displayed.
The AIR³ in the bottom has been set with a low opacity value to display the basic thermal overlay and a higher opacity value for the display of the time adjusted thermal overlay. This allows to see the expected thermal uplifts with low opacity value.

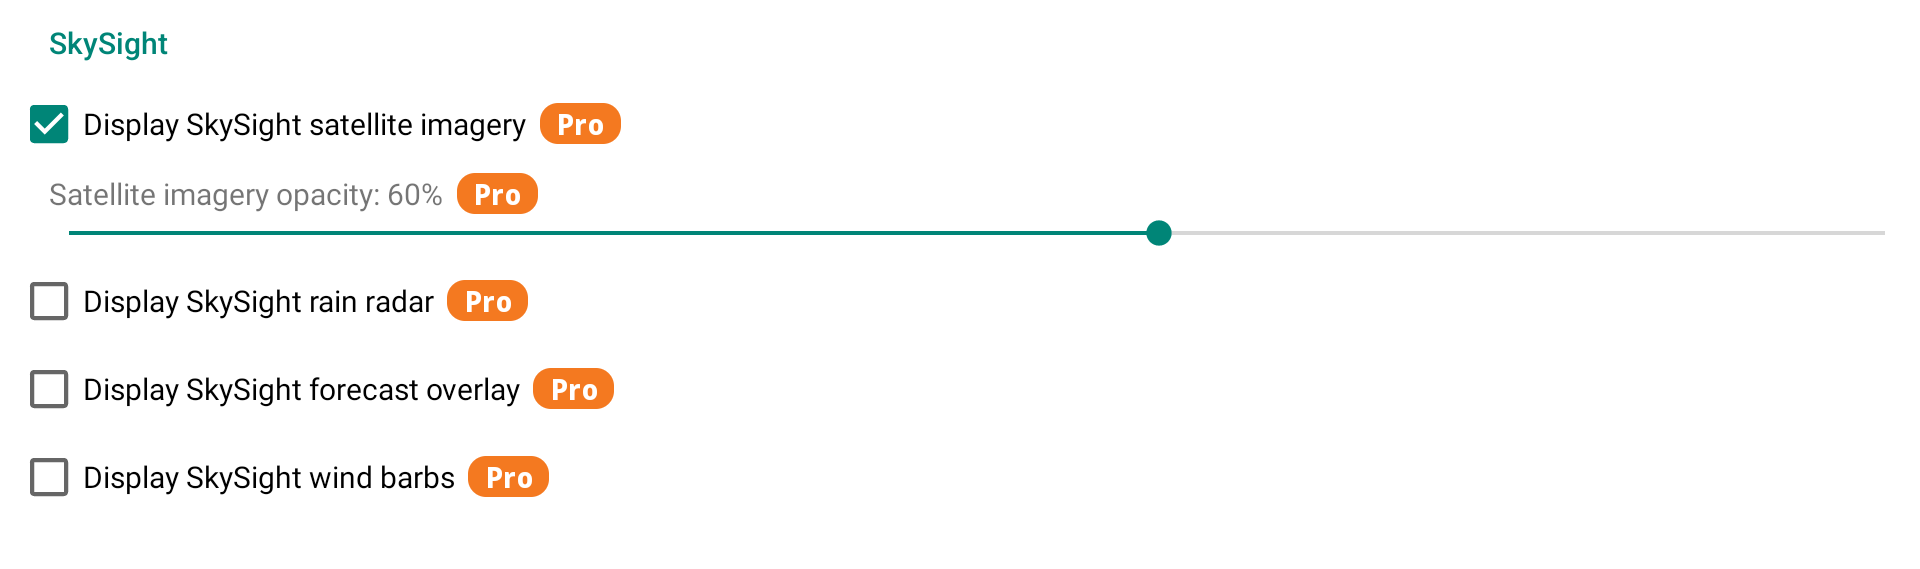
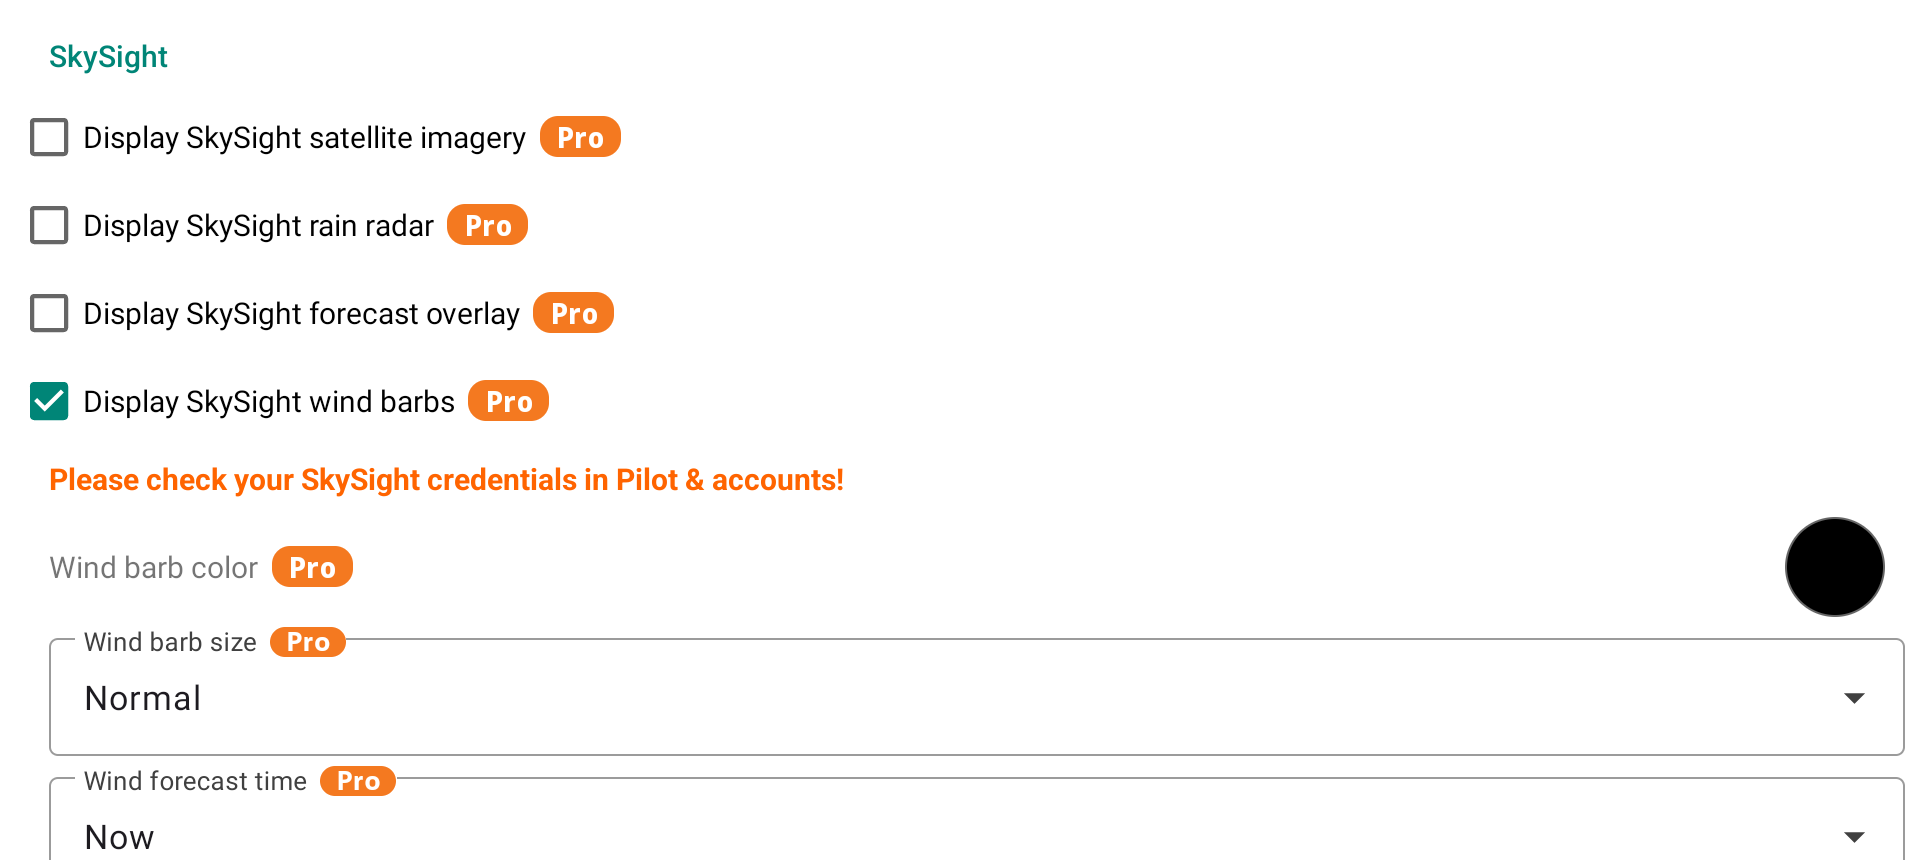
SkySight (Pro)
SkySight is a weather forecasting service tailored for free flight pilots. When enabled, SkySight data layers are overlaid directly on the map. A SkySight subscription and valid credentials (set in Menu/Pilot & accounts) are required.
Four layers are available:
- Satellite imagery — displays live satellite cloud imagery. An opacity slider lets you blend it with the underlying map.
- Rain radar — overlays live rain radar data on the map.
- Forecast overlay — displays a SkySight weather forecast layer on the map (Thermal Strength, Cu Cloudbase, XC Speed, Convergence, Thermal Wind, etc.). You can select which layer to display, adjust its opacity, and choose the forecast time — either Now or up to 4h ahead. Optionally, the forecast time can be shown on the map at a position of your choice.
- Wind barbs — shows forecast wind direction and speed across the map. You can customize the color, size (Small/Normal/Large), and forecast time and position (Now or a future time slot).
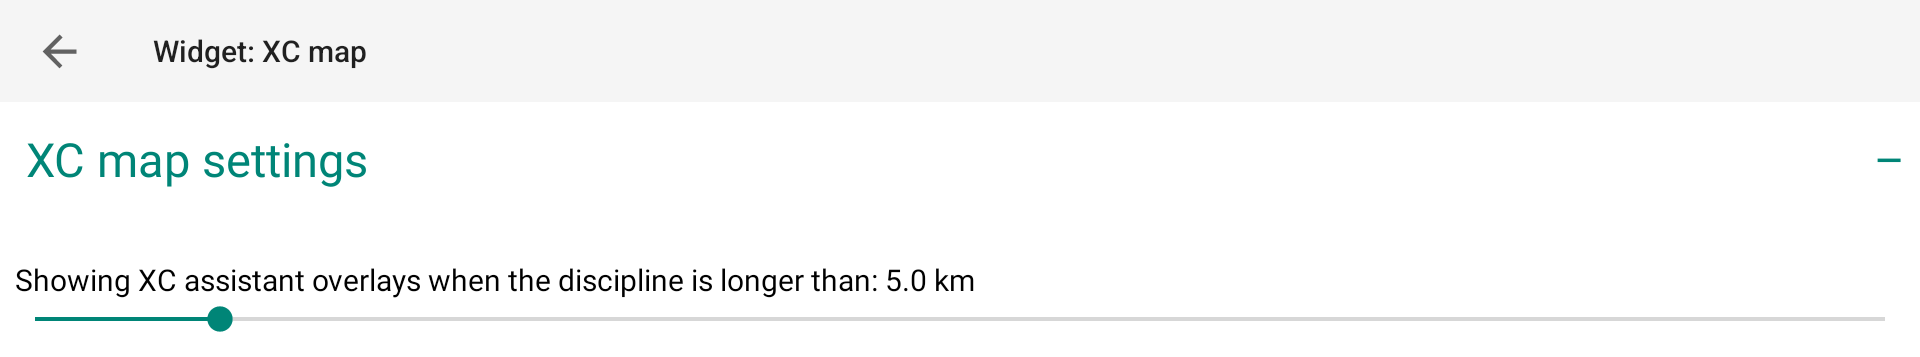
In the XC map settings section, you can display different tools that can help you manage your XC flight.
Different settings related to the XC discipline can be adjusted in Menu/Preferences/XC Disciplines and Competition.
Triangle closing distance: a flight may be scored as a triangle, when the distance between start point and finish point (= closing distance) is less than the percentage indicated of the entire distance as given by the 3 turn points. The scoring distance will then be given by the turn point distance, minus the gap (finish to start) distance.
Discipline factors: number of points per km depending on the type of flight: FAI triangle, Flat triangle or Flight over 3 turnpoints.
If you participate to the XCcontest competition, check here to adapt the settings accordingly.
Showing XC assistant overlays when the discipline is longer than: N km
The XC assistant draws overlays on the map to help optimize your XC flight (FAI triangle sectors, free distance lines, etc.). To avoid cluttering the map on short flights or at the beginning of a flight, these overlays are only displayed once your current discipline exceeds the defined distance threshold.
Display triangle/free flight route
By enabling “Display triangle/free flight route”, legs of your flight will be displayed.
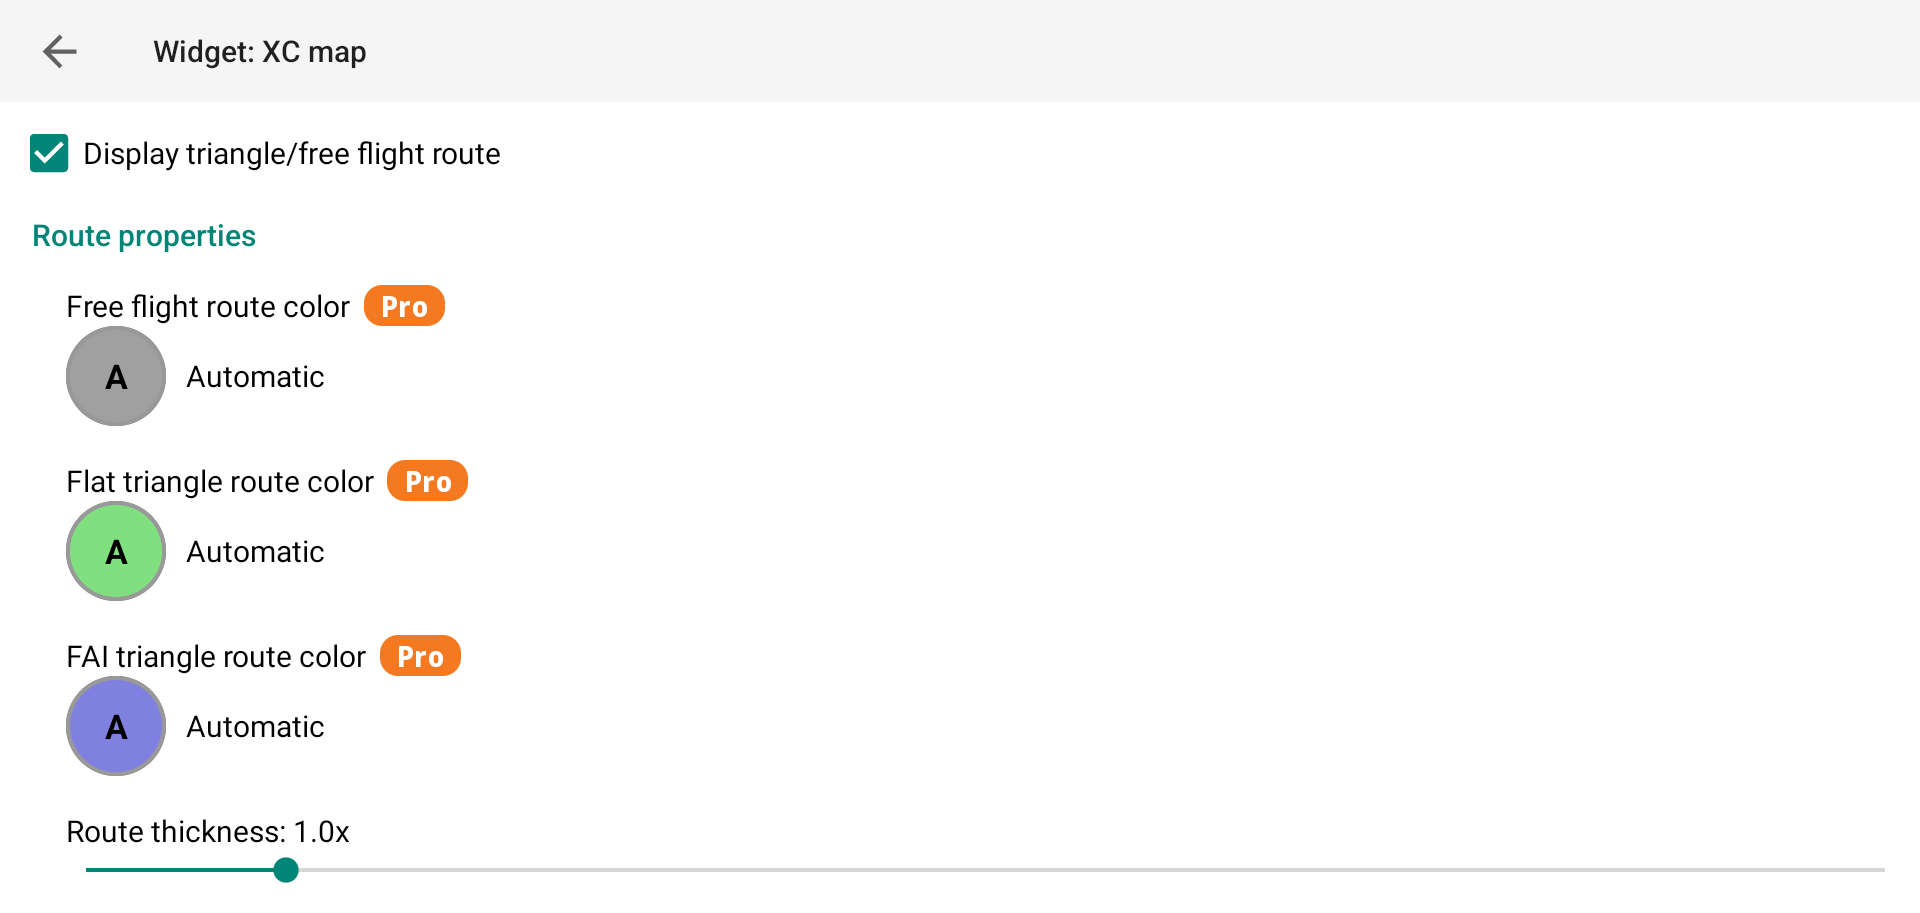
The FAI triangle will be displayed in blue by default. The flat triangle will be displayed in green. Free flight will be displayed in grey.
With the Pro version of XCTrack, you can customise these colors according to your preferences.
Thanks to the color screen on the AIR³, you can easily identify the discipline type.
The last slider allows you to adjust the thickness of the legs.

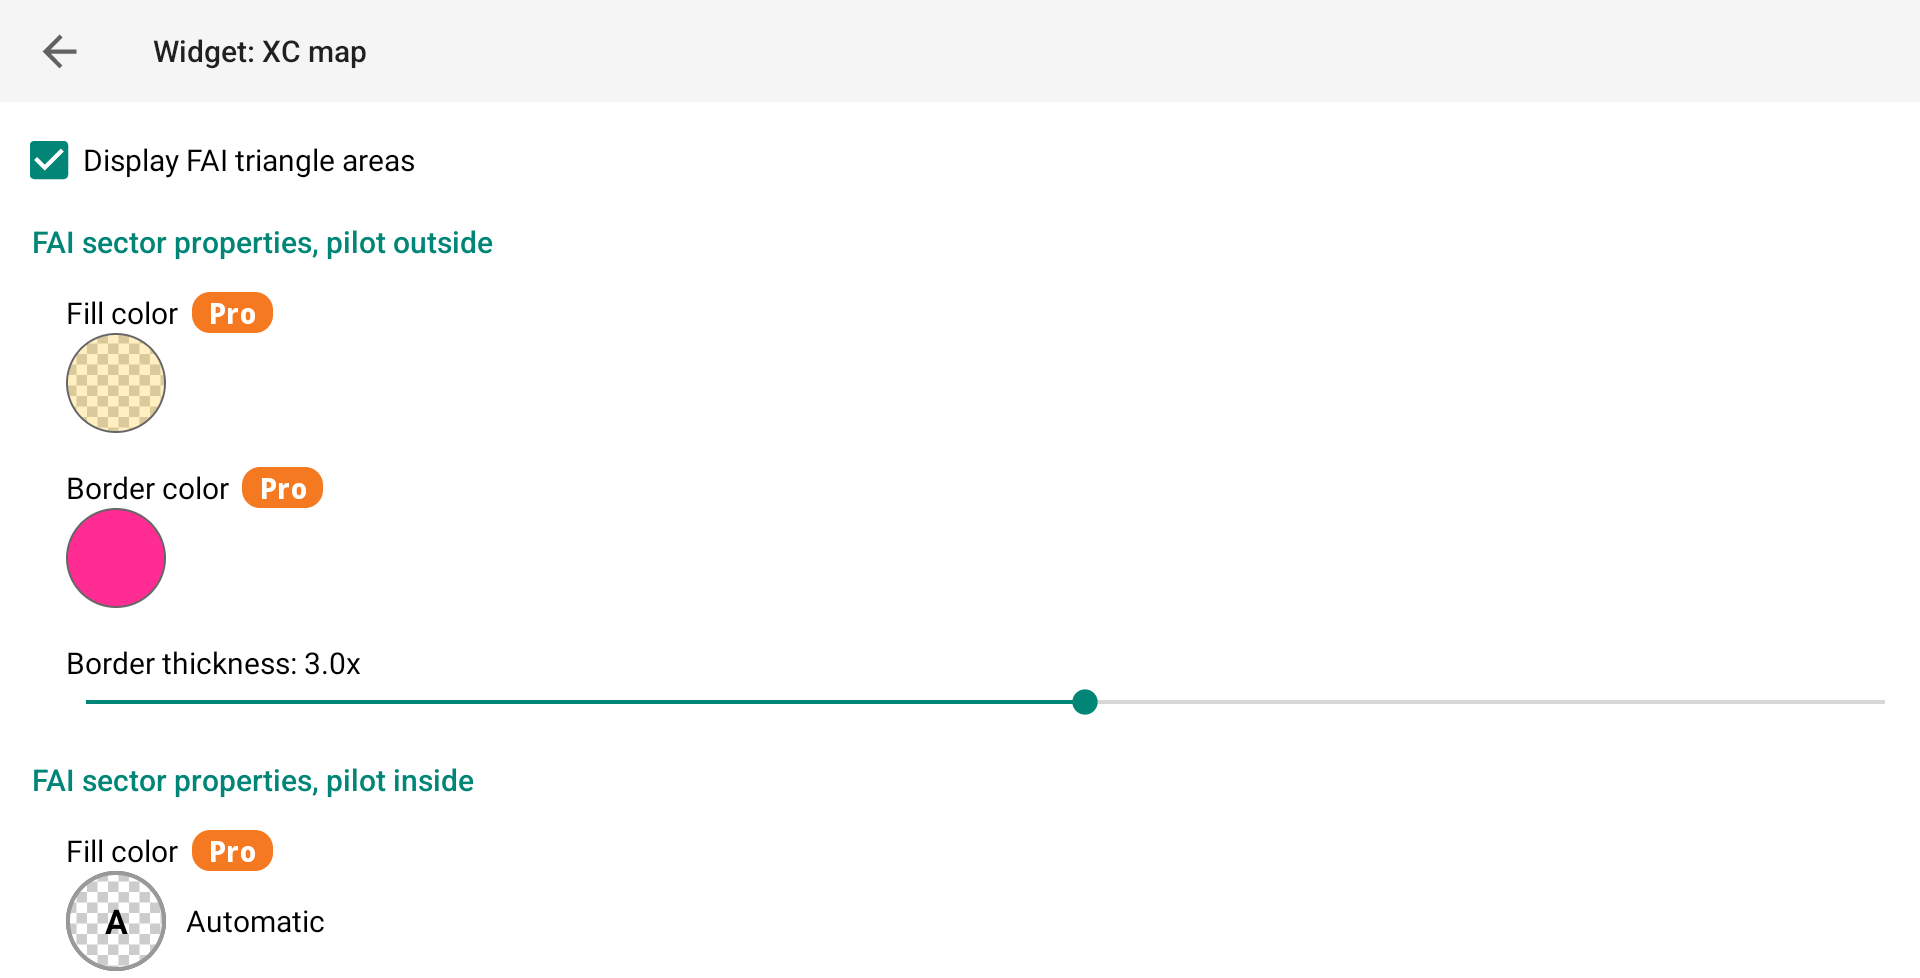
Display FAI triangle areas
Enabling “Display FAI triangle areas” allows you to identify the area in which you should fly to complete a FAI triangle.

With the Pro version of XCTrack, you can customize the colors of the FAI triangle areas and differentiate between the colors when you are inside or outside the areas.
You can also adjust the border thickness of both triangle areas.
Show min/max triangle length for FAI areas
If you also enable “Show min/max triangle length for FAI areas”, you will be able to see the minimum and maximum triangle length directly on the map allowing you to determine the route you should fly to achieve a FAI triangle.
Units can be changed in Menu/Preferences/Display/Units/Distance

The pro version of XCTrack gives you the opportunity to choose the color and the font size of the text displayed.

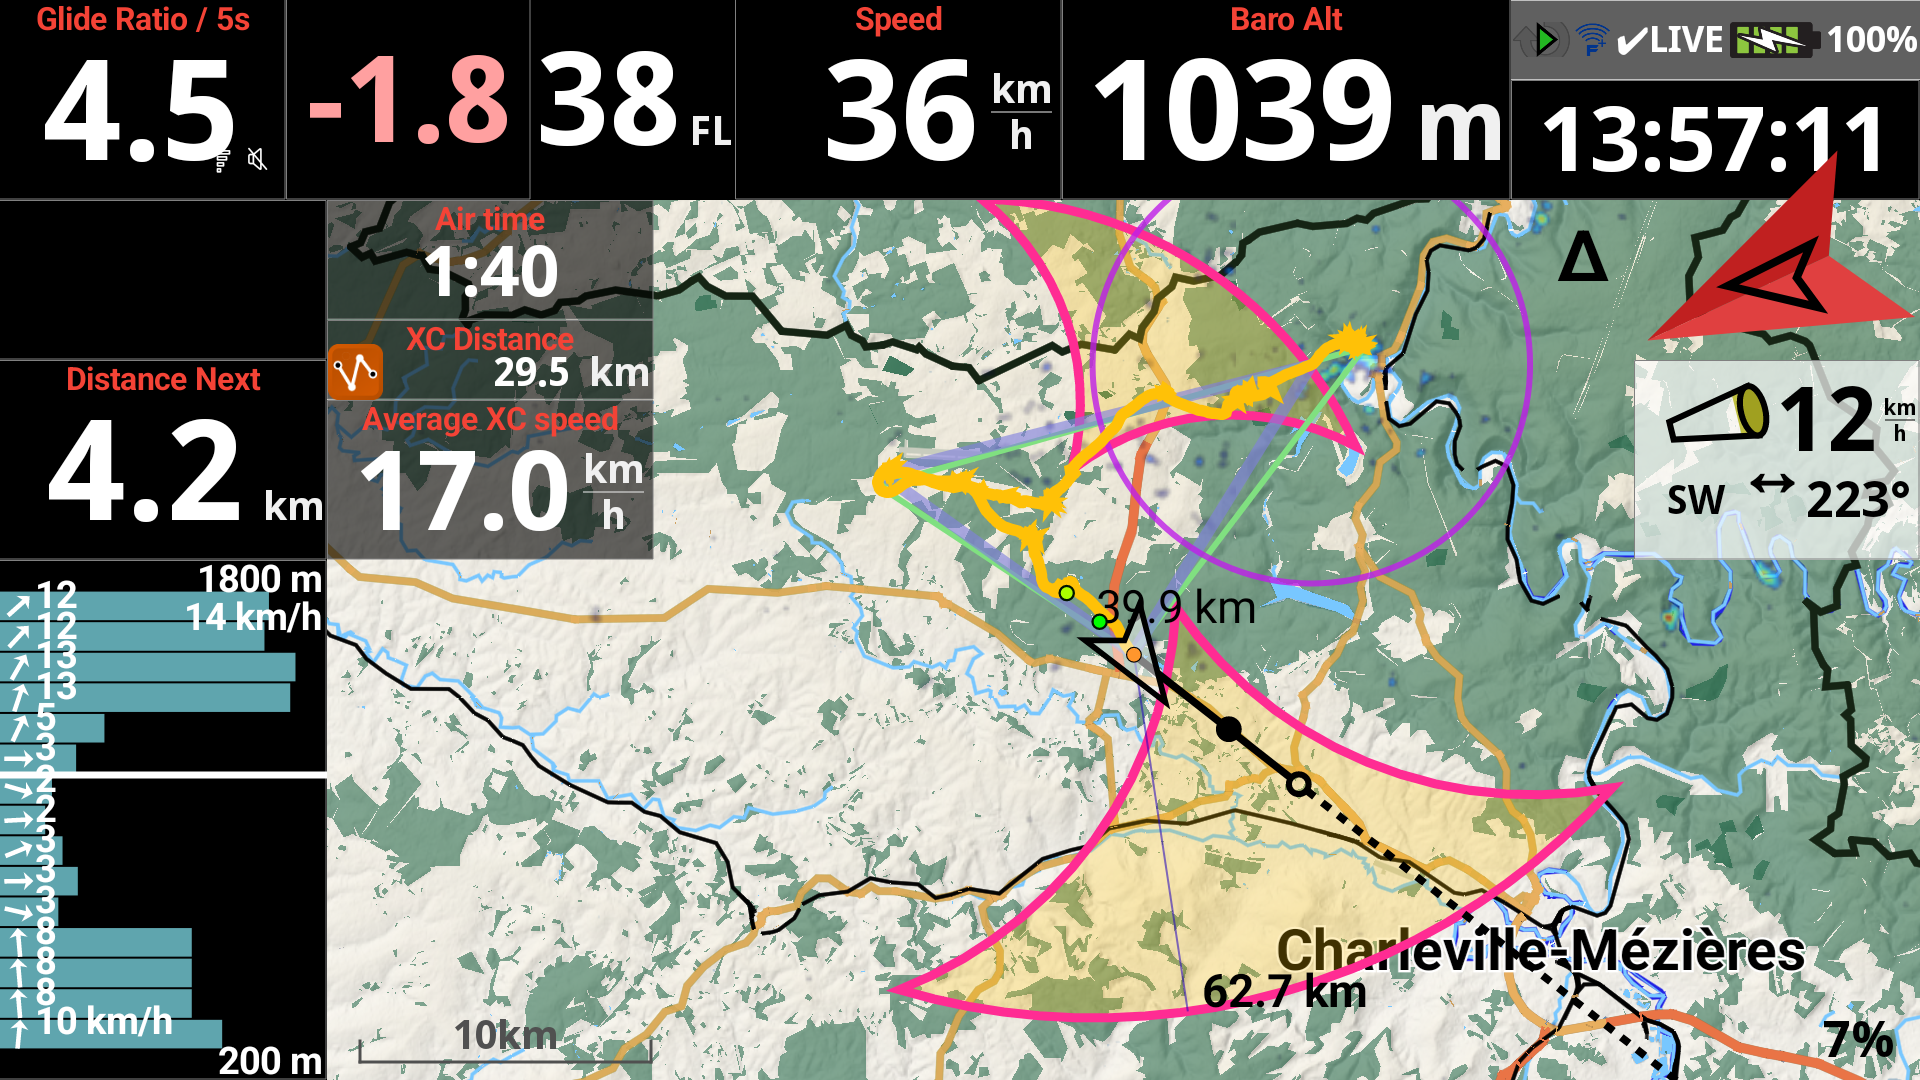
Enabling the display of triangle areas and min/max indications…
Pilot outside of the triangle areas before entering.
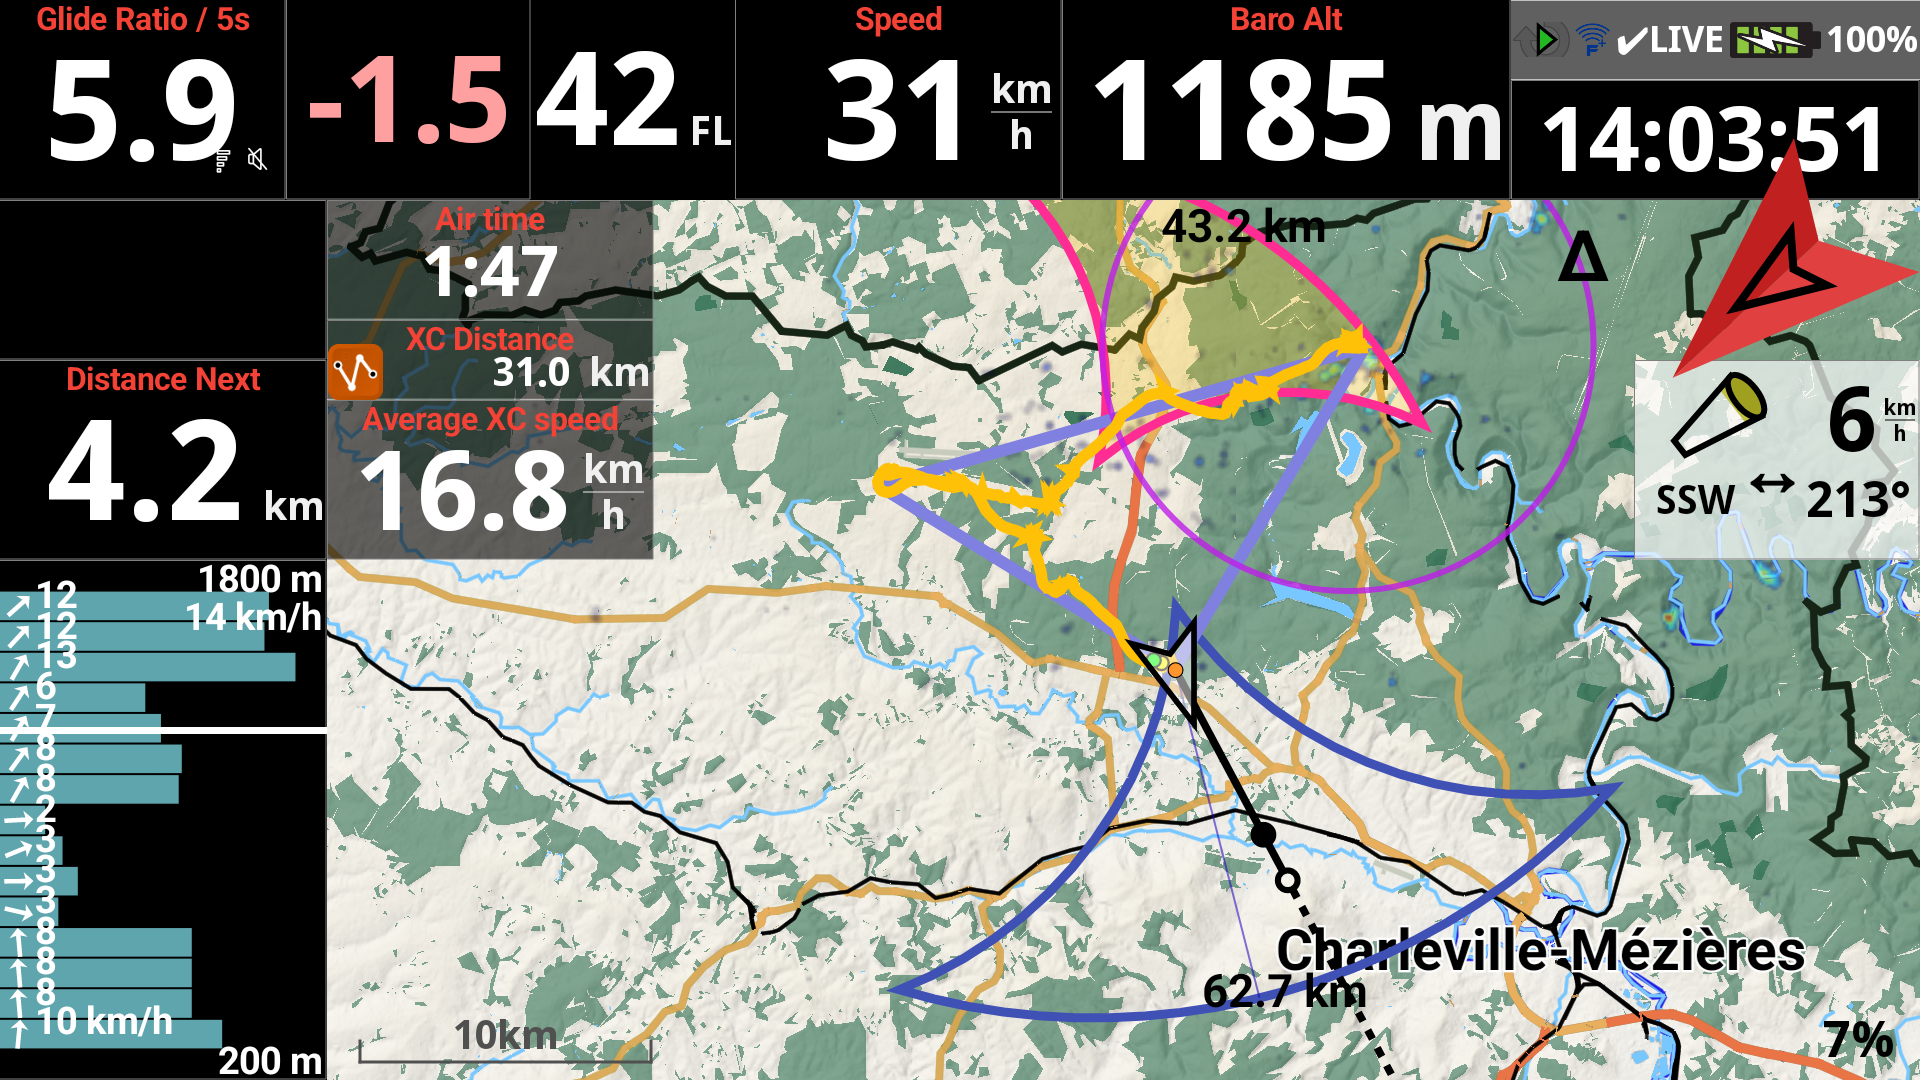
The pilot is inside the triangle area just after entering.
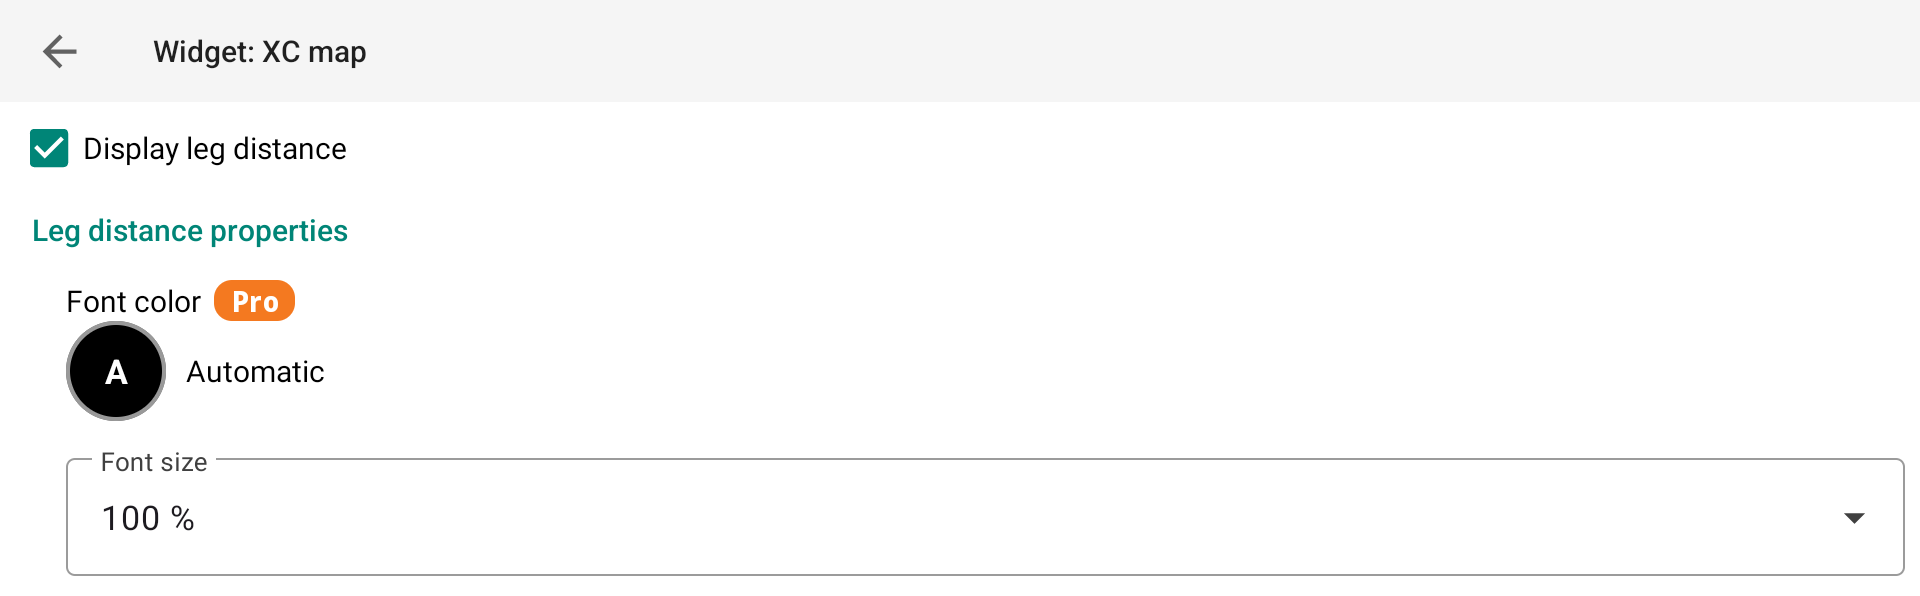
Display leg distance
Enabling “Display leg distance”, displays the leg distance already flown.
Units can be changed in Menu/Preferences/Display/Units/Distance in competitions
The pro version of XCTrack gives you the opportunity to choose the color and the font size of the text displayed.

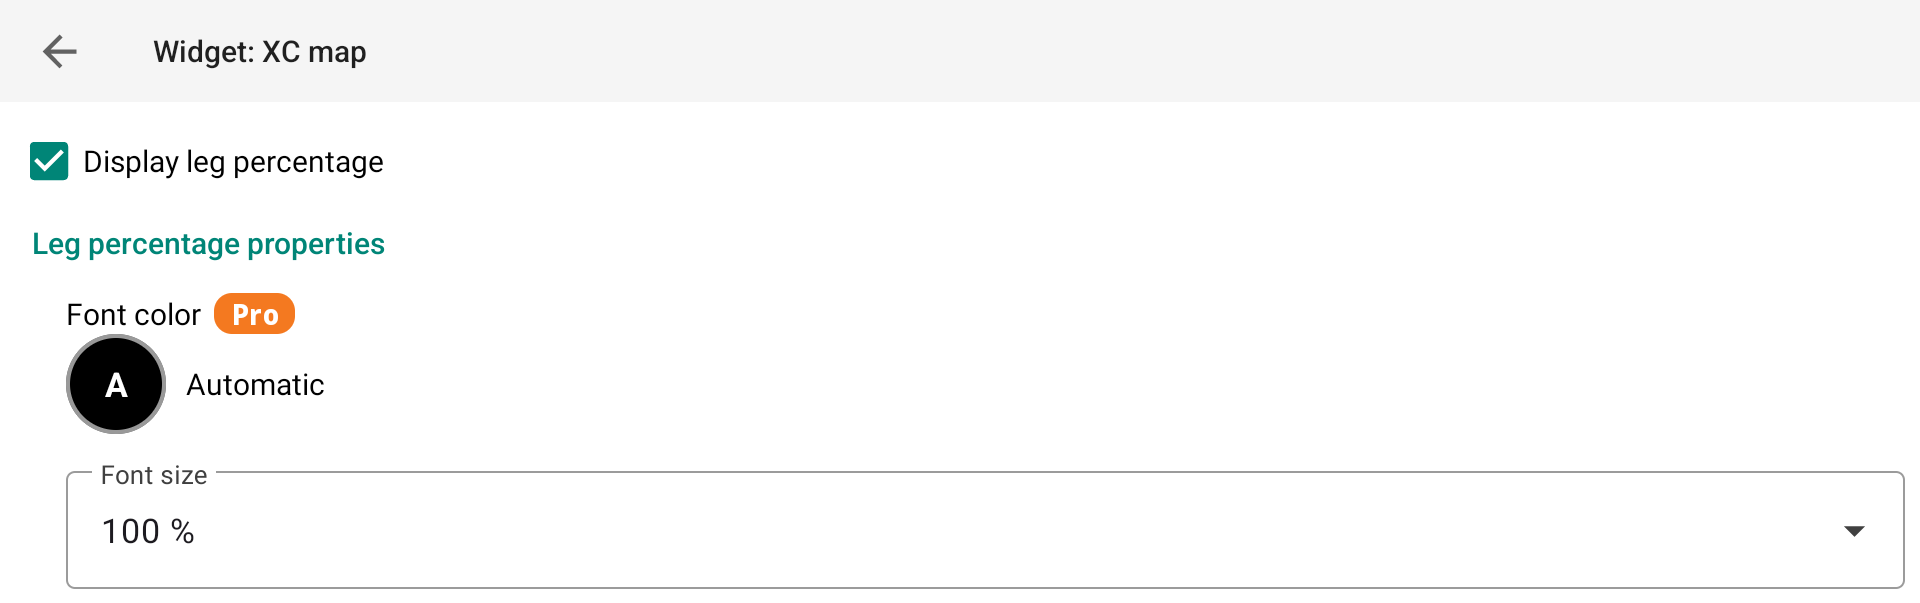
Display leg percentage
Enabling “Display leg percentage”, displays each leg percentage of the triangle you have already flown.
The pro version of XCTrack gives you the opportunity to choose the color and the font size of the text displayed.

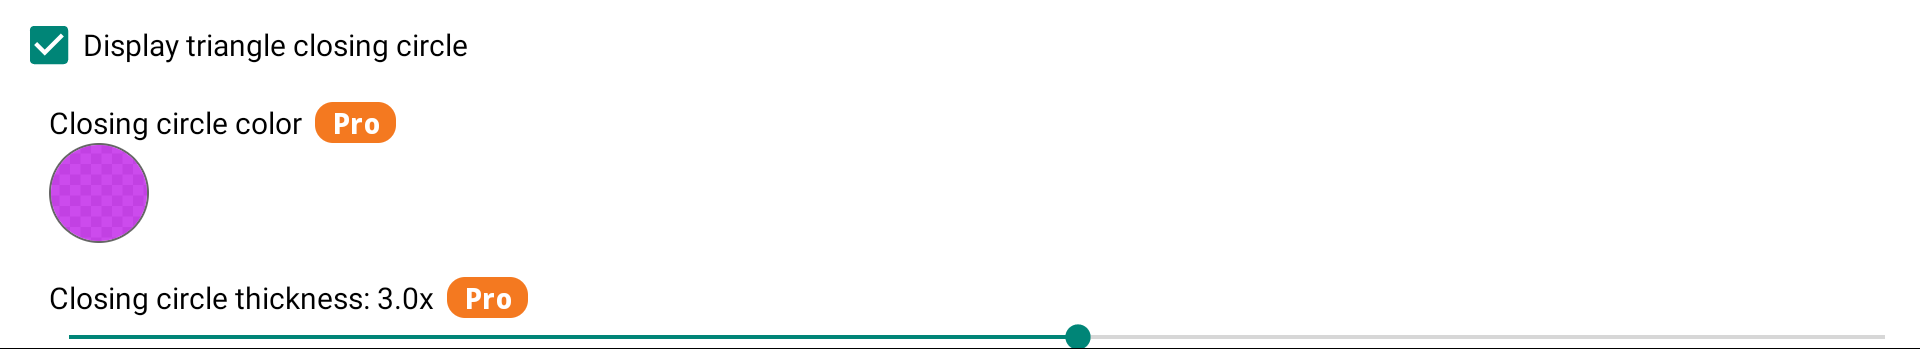
Display triangle closing circle
By enabling “Display triangle closing circle”, you will display on the map the area to reach if you want to close the triangle (flat or FAI).

With the Pro version of XCTrack, you can customize the color of the closing triangle circle.
You can also adjust the border thickness of the closing triangle circle.
As long as the discipline is considered as free flight distance, no triangle closing circle is displayed. As soon as the disciple can be considered as a flat or FAI triangle, the triangle closing circle is displayed.
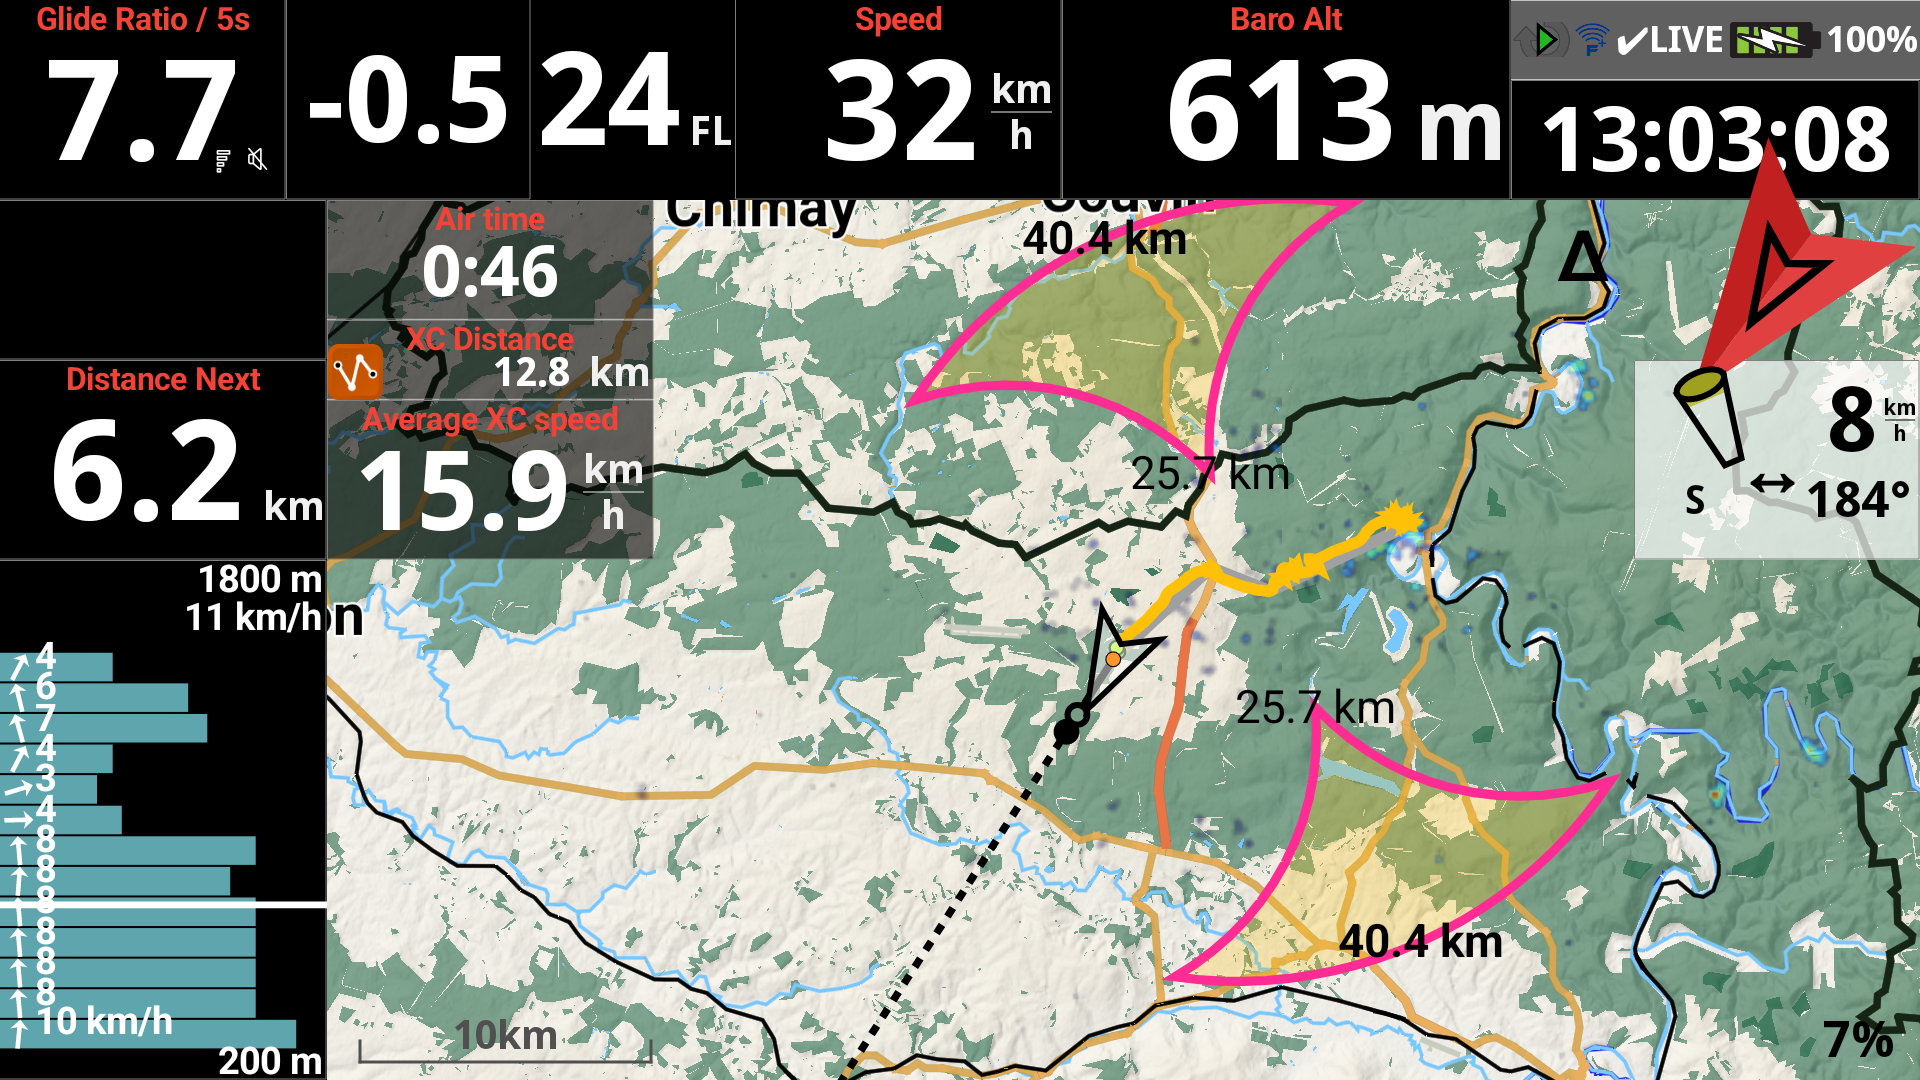
Discipline considered as free flight. No closing triangle circle.
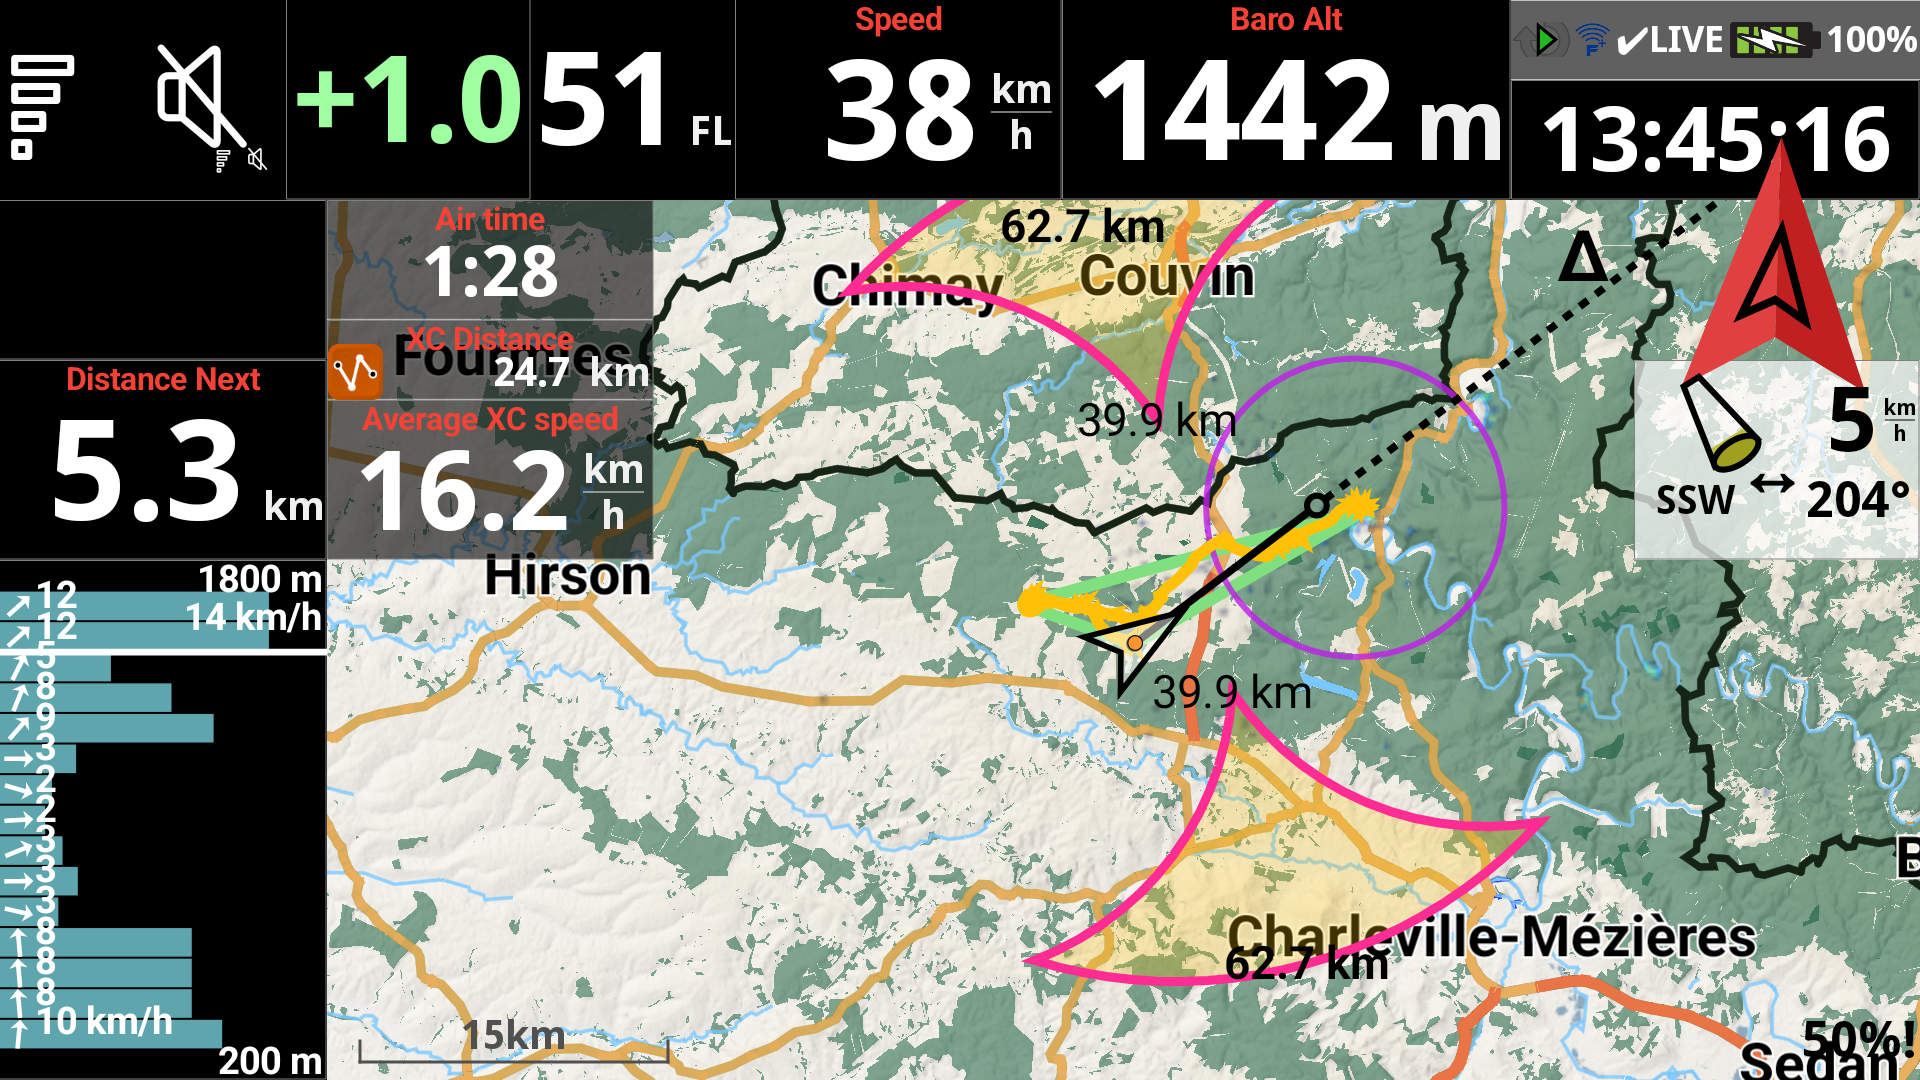
Discipline considered as flat triangle. Closing triangle circle displayed.
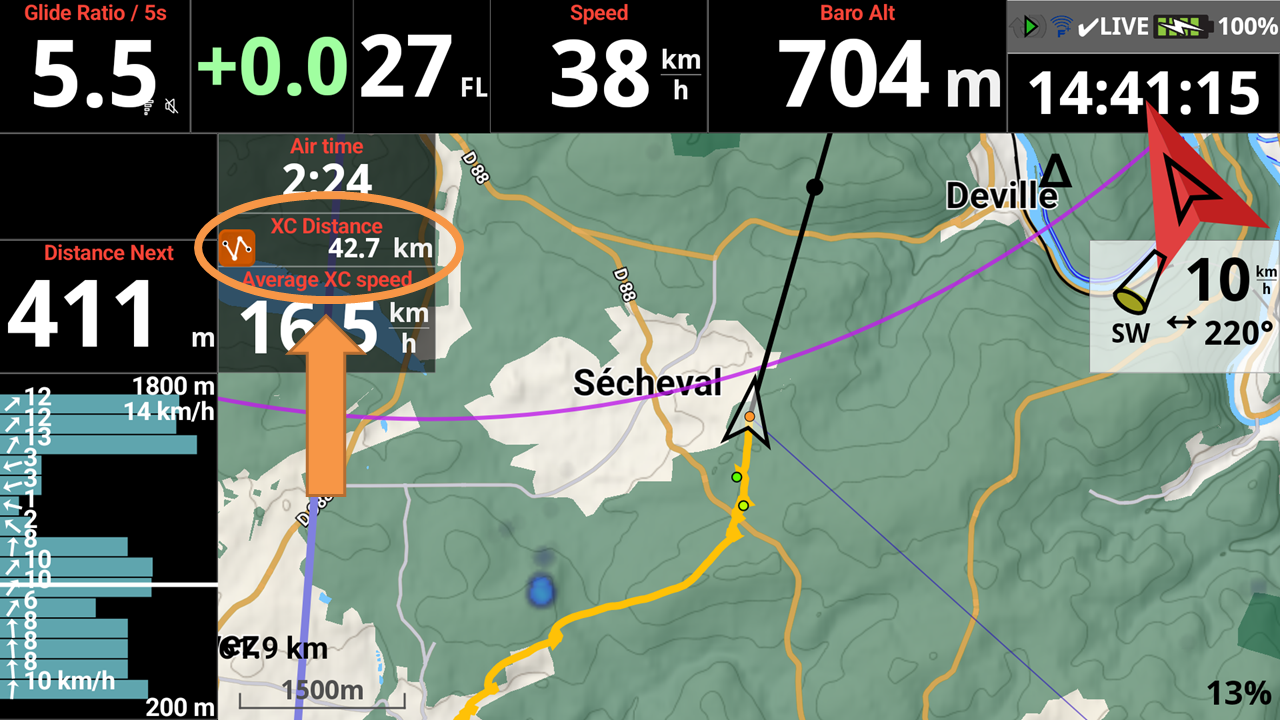
Before entering the closing triangle circle, the XC distance associated with the XC discipline is calculated as a free flight distance.
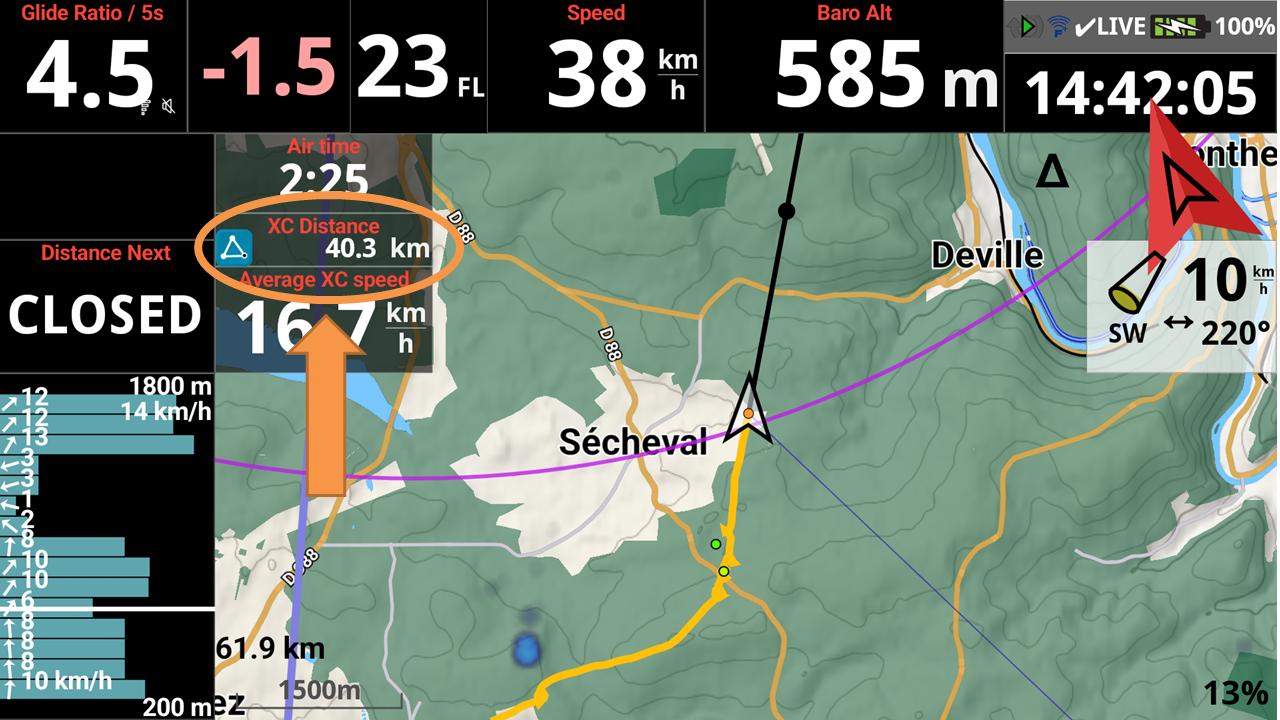
After entering the closing triangle, the XC distance associated with the XC discipline is calculated as an FAI triangle distance, provided that the conditions are met.
Next section